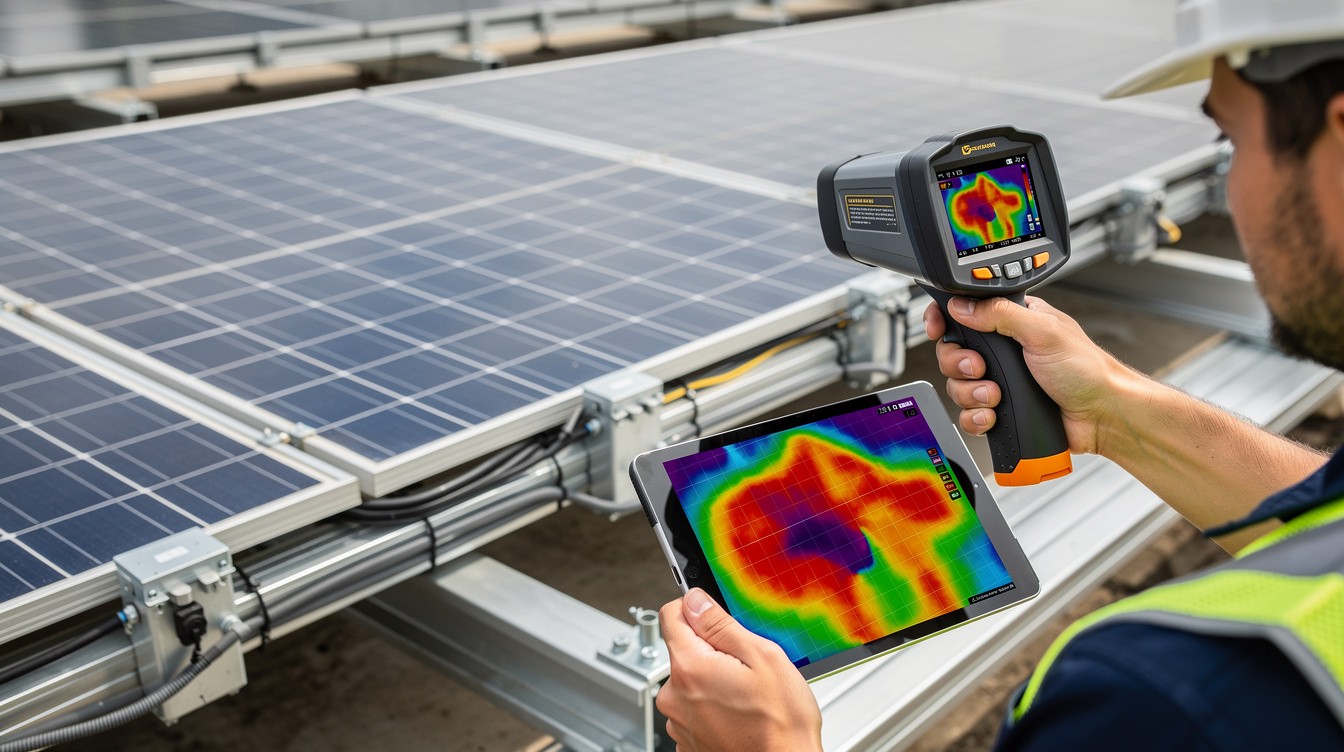
Solar panels lose efficiency silently. A single faulty connection or manufacturing defect can drag down your entire system’s output without any visible warning signs.
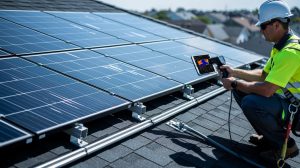
Solar performance imaging using thermal cameras reveals what your eyes cannot see. At IE Drone Services, we use this technology to identify problem areas before they cost you thousands in lost energy production.
Why Solar Panel Performance Monitoring Matters
Hot spots on solar panels represent real money leaving your system. When a defective cell or converter box develops, the surrounding healthy cells force current through the faulty area, converting electrical energy into heat instead of usable power.
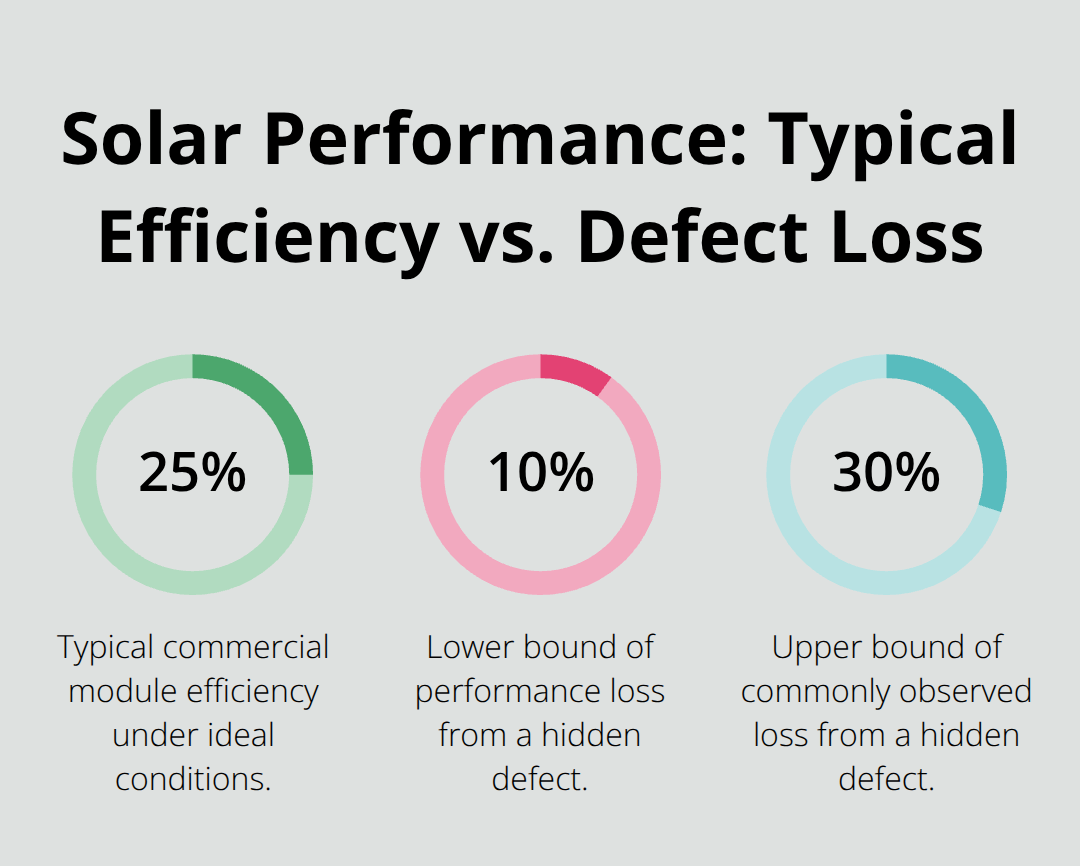
This heat signature remains invisible to the naked eye but thermal imaging detects it immediately. A single defective cell can reduce an entire string’s output, and if that cell sits near the end of the string, it blocks power from the entire section. Commercial solar modules typically reach about just under 25% efficiency, but a hidden defect can slash that performance by 10–30% or more depending on its location and severity. The longer you wait to identify these problems, the more energy and revenue slip away undetected.
Catching Failures Before Catastrophic Damage
Manufacturing defects and electrical faults don’t announce themselves. A faulty converter box generates localized heat that gradually damages adjacent cells through melted solder, cracked protective glass, and moisture ingress. Early detection prevents this cascade of degradation. Thermal imaging scans multiple panels simultaneously to locate efficiency-robbing defects and helps you prioritize repairs where impact is greatest. This approach aligns with harmonized O&M best practices by SolarPower Europe, which now formally recognizes aerial inspection providers as part of solar maintenance standards. The guidelines emphasize that routine health checks and performance verification through thermal inspection protect your long-term returns.
The ROI Case for Proactive Inspections
Skipping inspections assumes all panels operate at rated output, which rarely happens in real installations. A defective panel delivering 70% of its rated power means you lose 30% of that panel’s expected revenue every single day. Over a 20–30 year system lifespan, that loss compounds dramatically. Thermal data gives you concrete numbers on which panels underperform and by how much, transforming maintenance from guesswork into data-driven decisions. Documentation of performance trends over time reveals whether issues are static defects or progressive degradation, helping you decide between repair and replacement. Early intervention costs far less than waiting for catastrophic failures or gradual yield erosion that eats into your ROI for years.
Moving Forward with Thermal Inspection
Identifying these hidden problems requires specialized equipment and trained expertise. Thermal cameras reveal the electrical health of your panels through their heat signatures, but interpreting that data correctly separates effective maintenance from wasted effort. The next section explains exactly how thermal imaging works and what specific faults it uncovers in real solar installations.
How Thermal Imaging Reveals Hidden Solar Issues
Thermal imaging translates electrical problems into visible heat patterns that show exactly where your panels fail. When a defective cell blocks current flow, the healthy cells upstream force their electrical energy through that bad cell, converting power into heat instead of sending it to your inverter. This heat signature appears on a thermal camera as a bright spot against the cooler background of functioning cells. A single hot spot indicates either a defective cell within the panel or a faulty converter box attached to it, which is why interpreting the image correctly matters more than just finding the warm area. The location of the hot spot within the string determines its impact on your system’s total output. A defective cell near the beginning of a string causes less overall damage than one positioned at the end, which can block power from the entire section.
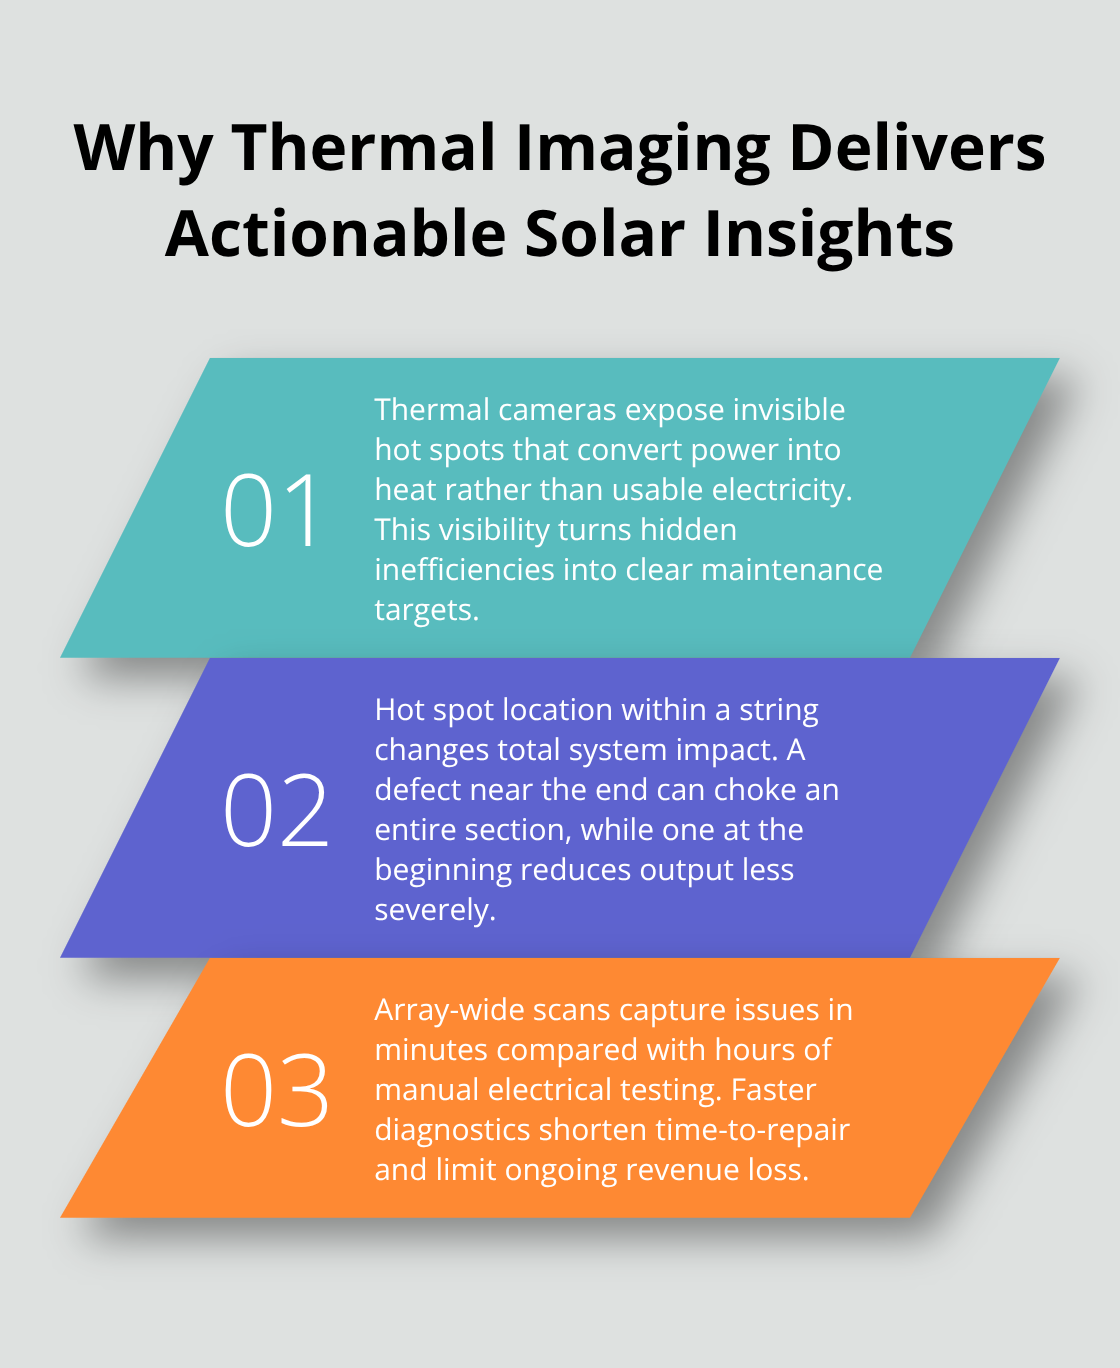
Thermal imaging scans your entire array in minutes, capturing data that would take hours to gather through manual electrical testing, and the results show you not just that a problem exists but where it exists and how severe it is.
Electrical Faults Create Distinct Temperature Signatures
A defective converter box generates localized heat that spreads differently than a single bad cell, creating a distinct thermal signature that experienced inspectors recognize immediately. This distinction matters because the repair strategy differs. A bad cell requires panel replacement or repair, while a faulty converter box can often be swapped without removing the panel. Melted solder, cracked protective glass, and moisture ingress follow when heat persists unchecked, causing adjacent cells to degrade progressively. The thermal data reveals whether a panel operates near its rated efficiency or whether hidden defects already steal power from its output. Over a 20 to 30 year system lifespan, that difference compounds into tens of thousands of dollars in lost revenue.
Manufacturing Defects Emerge Through Thermal Analysis
Quality control failures during panel production sometimes slip through initial testing, only revealing themselves after months of field operation. A manufacturing defect that appears minor under factory conditions can accelerate degradation when exposed to real-world temperature cycles and weather stress. Thermal imaging catches these defects early, before they cascade into broader system failures. The heat signature grows more pronounced as the defect worsens, so documenting your thermal data over time shows whether a problem is stable or progressive. This information guides your decision on whether to repair immediately or monitor closely before committing to replacement. Defects that worsen rapidly demand urgent action, while stable hot spots can sometimes wait for your next scheduled maintenance window if the performance loss is acceptable.
Prioritizing Repairs Based on Thermal Data
Thermal scans identify multiple problem areas across your array, but not all defects demand the same urgency. A panel losing output due to a minor manufacturing flaw ranks lower than one losing significant power from a faulty converter box. Thermal data quantifies performance losses, allowing you to allocate repair budgets where they generate the highest return. Documenting performance trends over time reveals whether issues are static defects or progressive degradation, helping you decide between repair and replacement. Early intervention costs far less than waiting for catastrophic failures or gradual yield erosion that eats into your ROI for years.
Moving Forward with Actionable Thermal Insights
Identifying these hidden problems requires specialized equipment and trained expertise. Thermal cameras reveal the electrical health of your panels through their heat signatures, but interpreting that data correctly separates effective maintenance from wasted effort. The next section explains the best practices for scheduling and conducting thermal inspections that deliver results you can act on immediately.
Best Practices for Solar Inspections and Maintenance
Commercial solar installations should undergo thermal imaging inspections annually during the first three years of operation, then every two years thereafter. We at IE Drone Services recommend an initial inspection within the first year of installation to establish a baseline and catch any manufacturing defects or installation errors before they worsen. After that, annual inspections during spring or fall capture seasonal performance shifts and identify problems before summer heat stress or winter weather damage accelerates degradation. If your system sits in a harsh climate with extreme temperature swings, dust storms, or salt spray exposure, consider inspections every six months instead. SolarPower Europe’s updated O&M guidelines emphasize that routine health checks and performance verification through thermal inspection protect your long-term returns, and aerial inspection providers now form a recognized part of these best practices. The cost of an annual thermal scan typically runs between $500 and $2,000 depending on array size, but a single defective panel costing you 10–30% of its output translates to thousands in lost revenue over just a few years. New installations should never skip that first-year inspection, because factory defects caught early prevent years of silent energy theft.
Scheduling Inspections That Match Your System’s Needs
Your inspection frequency depends on three factors: system age, local climate conditions, and historical performance data. New systems need that critical first-year scan to verify proper installation and catch factory defects before they cascade into broader failures. Mature systems benefit from annual inspections that track whether existing defects remain stable or worsen over time.
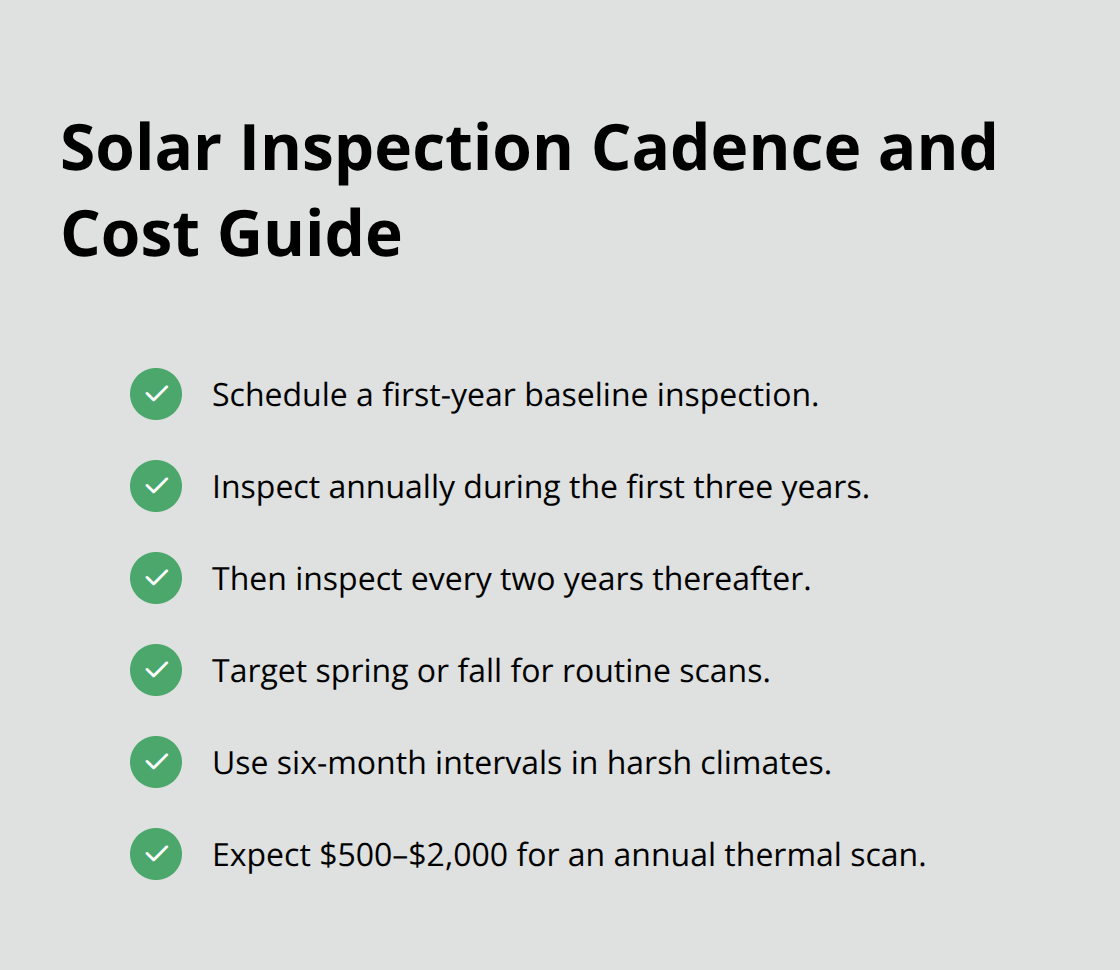
Harsh climates demand more frequent monitoring because temperature swings, salt spray, and dust storms accelerate degradation and create new faults faster than mild climates do. Spring and fall inspections capture the transition periods when thermal stress shifts, revealing problems that summer heat or winter cold might mask. Document your inspection schedule in writing and stick to it-consistency matters more than perfect timing.
Interpreting Thermal Images for Repair Decisions
Thermal images show temperature differences, but raw images mean nothing without context about your panel specifications and electrical configuration. A hot spot appearing on a thermal image requires you to know the panel’s rated output, the string configuration, and whether the defect sits early or late in the string to estimate its actual impact on total system performance. Temperature alone does not tell you whether a panel loses 5% or 50% of its output. Thermal data analysis compares heat signatures against your system’s electrical specifications and historical performance records to quantify exactly how much power each defect steals. This analysis transforms abstract heat signatures into concrete numbers: Panel A loses 2.4 kW annually, Panel B loses 0.6 kW annually. Those numbers guide your repair budget toward the panels generating the highest return on investment.
Tracking Performance Trends Over Time
Documenting your thermal data over multiple seasons reveals whether a hot spot remains stable or grows progressively hotter, indicating whether the defect is static or worsening. A stable defect affecting minor output can sometimes wait until your next planned maintenance window, while a progressively worsening hot spot demands immediate action to prevent cascade failures in adjacent cells. Store your thermal images alongside your electrical performance logs so you can correlate visual defects with actual power production drops, creating an evidence trail that justifies repair decisions to investors or asset managers. This historical record also shows whether your maintenance efforts actually improve system performance or whether new defects appear faster than you can repair them.
Prioritizing Repairs Based on Impact
Thermal scans identify multiple problem areas across your array, but not all defects demand the same urgency. A panel losing output due to a minor manufacturing flaw ranks lower than one losing significant power from a faulty converter box. Thermal data quantifies performance losses, allowing you to allocate repair budgets where they generate the highest return. A defective panel costing you 10–30% of its output creates far more financial impact than one losing 2–3% to minor manufacturing variations. Focus your repair efforts on the panels that steal the most revenue, then address secondary defects as budget allows. This prioritization approach prevents you from wasting money on low-impact repairs while high-impact defects continue draining your system’s profitability.
Final Thoughts
Solar performance imaging transforms maintenance from reactive firefighting into strategic asset management. A single defective panel losing 10–30% of its output generates tens of thousands in lost revenue across a 20–30 year system lifespan, yet an annual thermal scan costing $500–$2,000 identifies exactly which panels underperform and by how much. Manufacturing defects caught in year one prevent years of silent energy theft, while electrical faults detected early cost far less to repair than waiting for catastrophic failures that damage adjacent equipment.
Scheduling regular inspections during spring or fall captures seasonal performance shifts and reveals problems before extreme weather accelerates degradation. Documenting your thermal data over multiple seasons shows whether defects remain stable or worsen progressively, and this historical record transforms abstract heat signatures into concrete numbers that justify maintenance budgets to investors and asset managers. The financial case for proactive inspections is straightforward: the thermal data you collect today becomes the evidence that justifies repair decisions tomorrow.
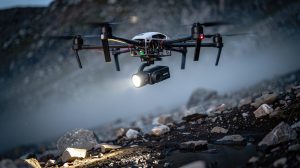
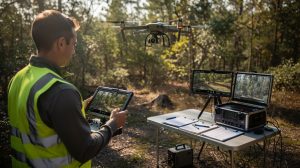
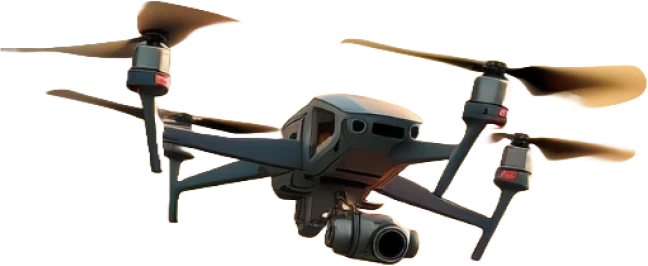
We at IE Drone Services use FAA-certified drone platforms with high-resolution and infrared cameras to deliver precise, actionable data that improves your solar system’s efficiency and performance. Our solar performance imaging inspections identify underperforming panels, electrical faults, and manufacturing defects before they cost you thousands in lost production. Contact us today to schedule your inspection and start protecting your system’s profitability with data-driven maintenance decisions.