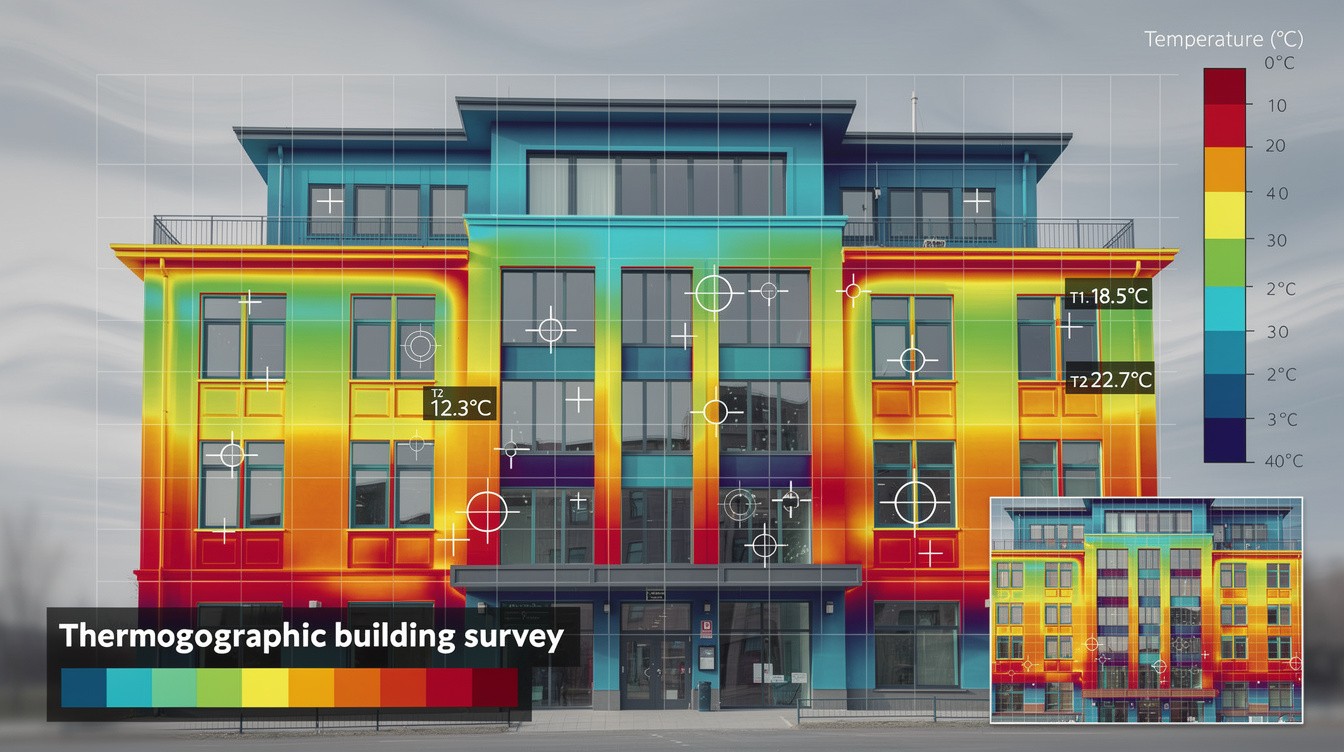
Building owners lose thousands of dollars annually to undetected energy waste and hidden moisture problems. A thermographic building survey reveals exactly where your property is losing heat, wasting energy, and developing damage-before small issues become expensive repairs.
At IE Drone Services, we use high-resolution thermal imaging to give you the complete picture of your building’s condition. This guide walks you through how thermal technology works, what it can find, and why professional thermal inspections pay for themselves.
Understanding Thermal Imaging Technology
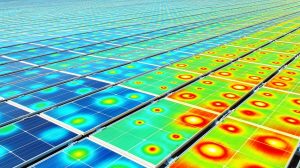
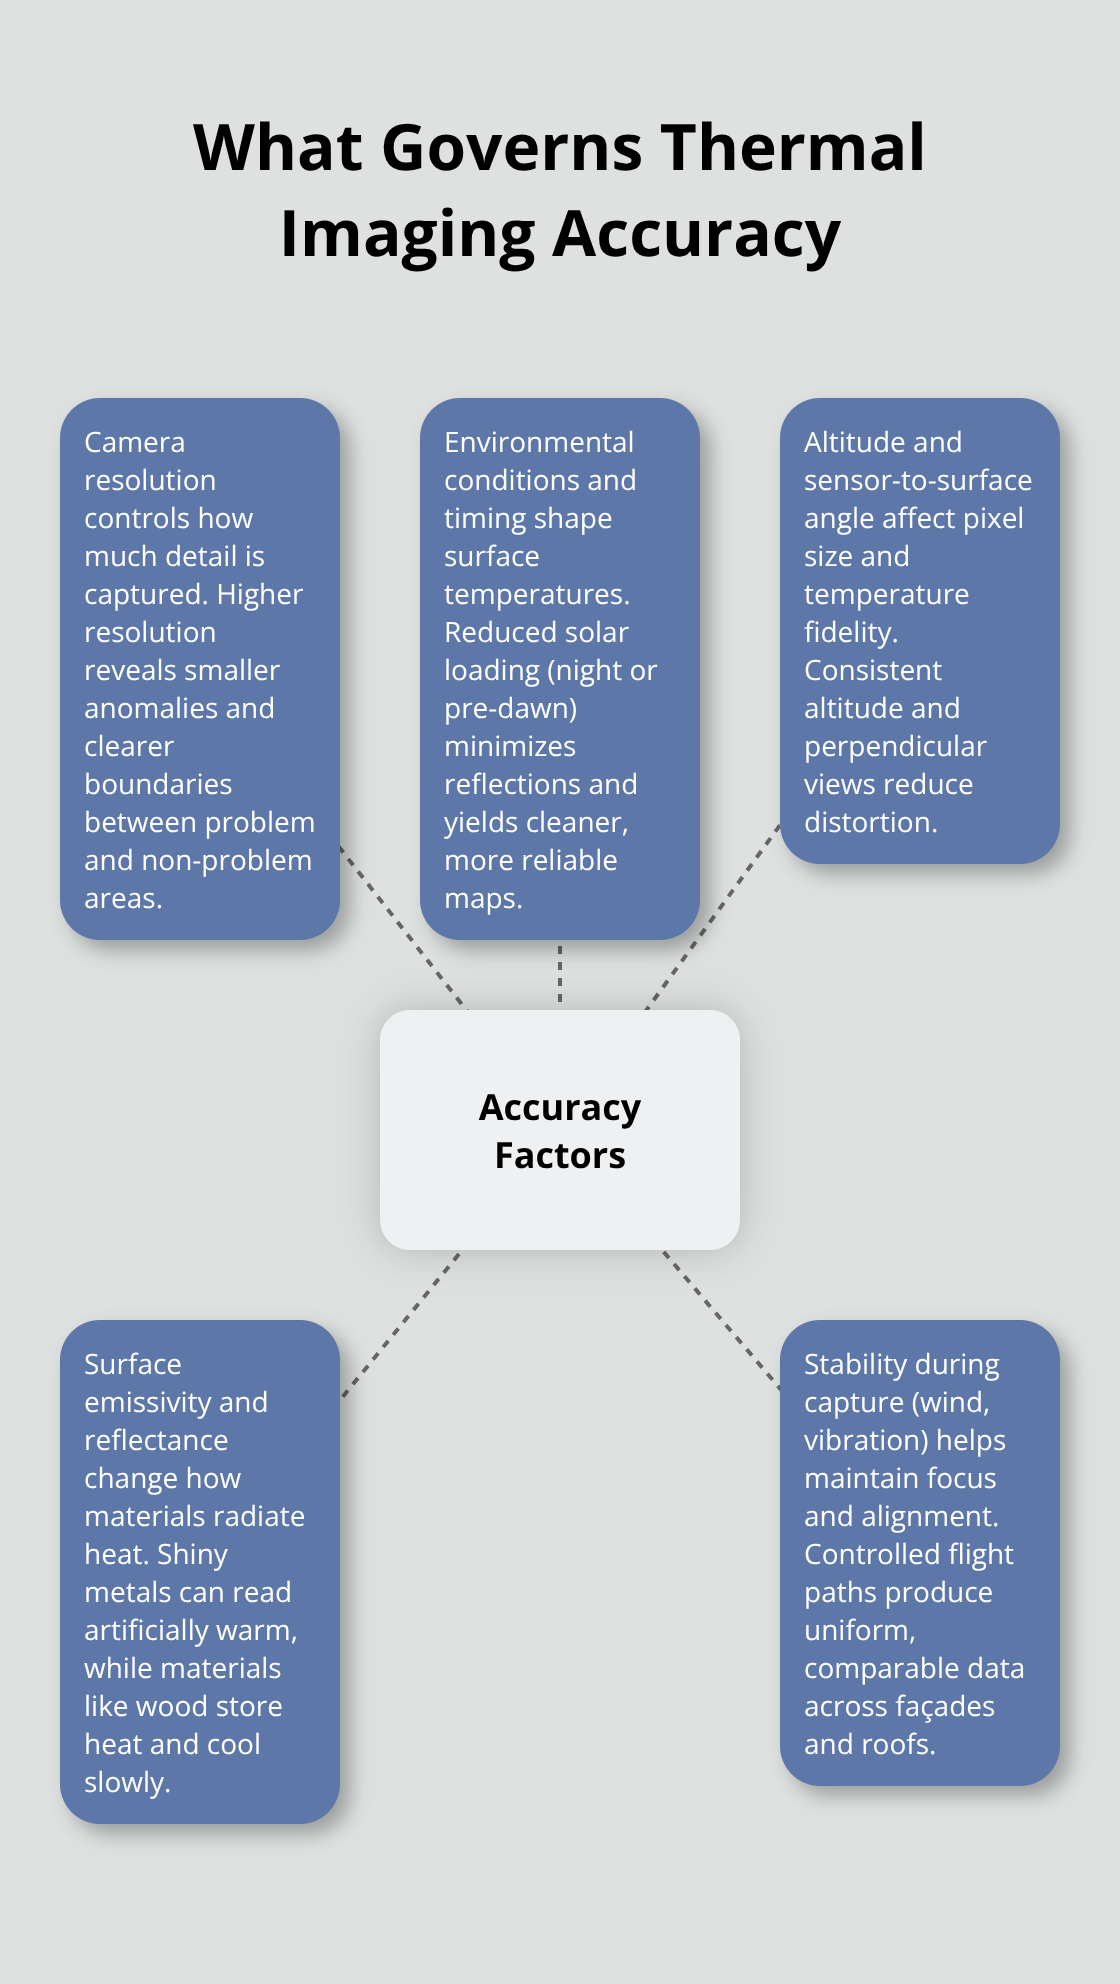
Thermal imaging captures infrared radiation that surfaces emit and converts it into visible heat maps that reveal temperature variations invisible to the human eye. Every object above absolute zero radiates heat, and thermal cameras detect this radiation across a building’s exterior and interior systems. The technology requires no visible light, which means it works equally well during daylight or nighttime, though night surveys often produce clearer results because reduced sunlight minimizes reflective interference that can distort readings. Thermal cameras measure temperature differences as small as ±0.1°C, making them sensitive enough to detect subtle insulation failures, moisture intrusion, and electrical faults that standard inspections miss. The accuracy of these measurements depends directly on three factors: camera resolution, environmental conditions at the time of capture, and the altitude from which data is collected.
Resolution Standards That Actually Matter
Camera resolution determines how much detail appears in your heat maps, and this matters far more than most property owners realize. High-resolution thermal cameras mounted on aircraft capture data across entire buildings or roof areas, revealing specific problem zones rather than general hot spots. Lower-resolution thermal imaging might tell you a roof is losing heat, but high-resolution mapping shows exactly which sections of insulation have failed and which HVAC components are overheating. This precision transforms a thermal survey from a curiosity into an actionable tool for prioritizing repairs and retrofit investments. When you receive heat maps from a thermal survey, verify that the resolution specification is documented in the report and that it matches your building’s size and complexity.
Why Environmental Context Changes Everything
Thermal readings respond dramatically to surface materials, weather conditions, and occupancy patterns at the moment of capture. Older buildings with thick masonry walls exhibit lower apparent heat loss on thermal maps despite potentially poor insulation, because dense materials store thermal energy longer than newer lightweight construction. Glass, aluminum, and reflective surfaces create misleading readings because they absorb, reflect, and transmit solar energy differently than opaque materials. Water on flat roofs, active ventilation exhausts, and thermal bridges from architectural features all appear as red zones on heat maps, but trained interpretation distinguishes between actual insulation problems and these normal conditions. Wind, rain, and direct sunlight before a survey can skew results significantly, which is why professional thermal surveys document environmental conditions and timing. A heat map captured immediately after sunrise tells a completely different story than one taken in afternoon sun, even for the same building.
What Professional Surveyors Know About Accuracy
Professional thermal surveyors account for material properties, reflectance effects, and thermal inertia when they interpret your heat maps. They recognize that smooth, high-reflectance surfaces (such as aluminum roofs) can appear warmer due to reflectance effects, while materials like wood or tar absorb and store energy, affecting how they register on thermal images. Ventilation components like chimneys and extraction vents appear as red dots on roofs and require correlation with roof design for accurate interpretation. This expertise separates a useful thermal survey from one that misidentifies normal thermal patterns as defects. The next section covers how professionals conduct infrared drone inspections that produce reliable, actionable data for your property.
Where Thermal Surveys Reveal Hidden Building Problems
Thermal imaging exposes three categories of problems that standard inspections consistently miss: energy waste through insulation failures, moisture damage developing behind walls and under roofs, and HVAC equipment operating inefficiently. These aren’t theoretical concerns-they represent thousands of dollars in annual losses across commercial and residential properties. Thermal surveys capture the complete thermal signature of your building, transforming infrared data into heat maps that show exactly where money escapes and where damage takes root.
Energy Loss Through Insulation Failures
Energy loss through poor insulation dominates thermal survey findings across most buildings. Heat maps reveal insulation gaps, thermal bridging through structural elements, and areas where insulation has settled or deteriorated over time. This precision allows property managers to prioritize retrofit investments on the worst-performing sections rather than replacing entire roof systems.
A roof showing yellow or orange zones in your heat maps needs immediate attention; those sections lose substantially more heat than surrounding areas and represent the highest return on retrofit spending. Green zones indicate moderate performance and can often wait, while light blue zones suggest acceptable insulation that may not justify replacement costs.
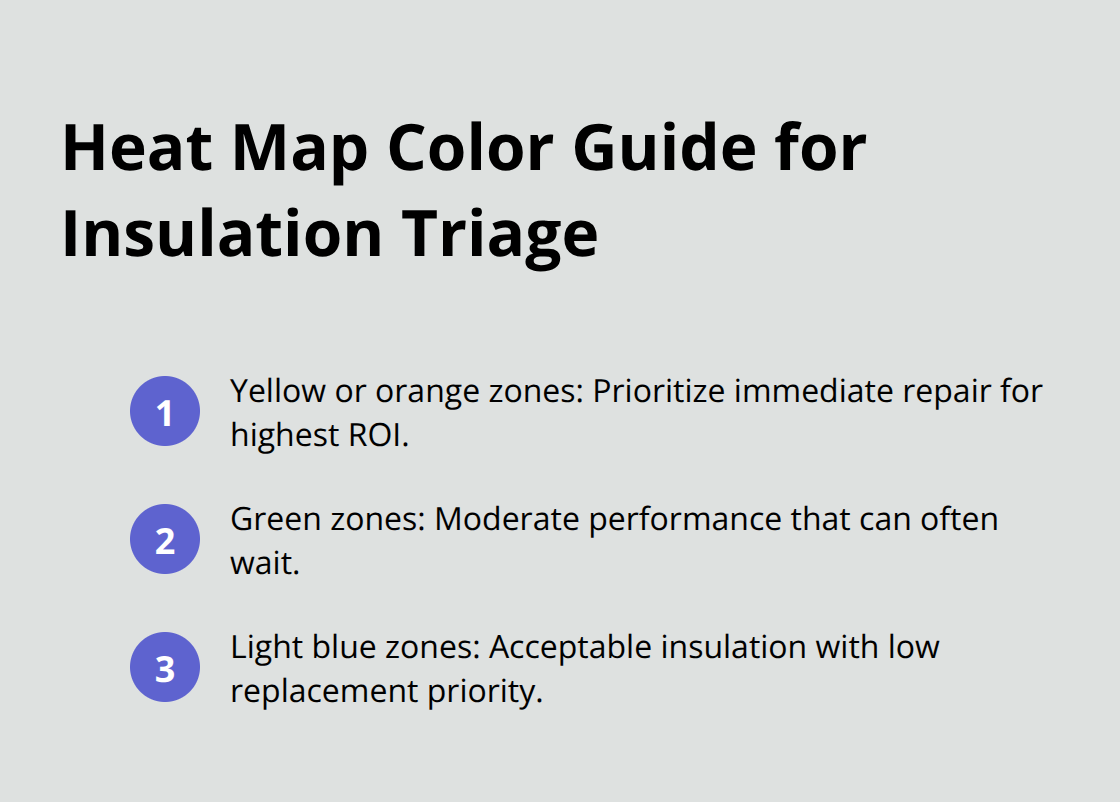
The color coding transforms abstract thermal data into a clear prioritization framework for your building maintenance budget.
Detecting Moisture and Water Damage
Moisture problems hide behind energy patterns and cause structural damage that accelerates rapidly once water intrusion begins. Water intrusion, roof leaks, and foundation seepage don’t announce themselves until structural damage becomes severe and repair costs explode. Thermal imaging detects moisture because wet materials exhibit different thermal properties than dry ones; moisture concentrations show up as temperature anomalies on heat maps.
A surveyor trained in moisture detection interprets these patterns correctly-distinguishing between actual water damage and normal thermal variations from material differences or ventilation exhausts. This expertise prevents false alarms that waste money on unnecessary repairs while ensuring you catch real problems before they spread. The ability to identify moisture before visible damage appears saves property owners tens of thousands of dollars in remediation costs.
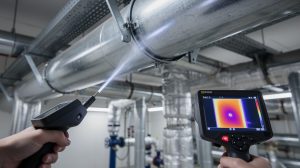
Identifying HVAC System Inefficiencies
HVAC systems waste enormous amounts of energy when components malfunction or operate inefficiently, and thermal surveys identify overheating in compressors, inefficient heat exchangers, and refrigerant leaks through hot spots visible on building exteriors. When you receive heat maps from a professional thermal survey, those red zones on mechanical equipment demand immediate inspection by your HVAC contractor. Catching these failures through thermal imaging prevents cascading equipment damage and months of reduced system efficiency.
Professional thermal surveys transform building management from reactive (waiting for problems to become visible) to proactive (identifying and prioritizing problems before they escalate). The heat maps themselves become negotiation tools in real estate transactions, providing clear visual evidence of defects that strengthen your position during property sales or lease negotiations. Understanding what these heat maps reveal is only half the equation-the other half depends on how professionals collect and interpret the data itself.
How Professional Thermal Surveys Get Conducted
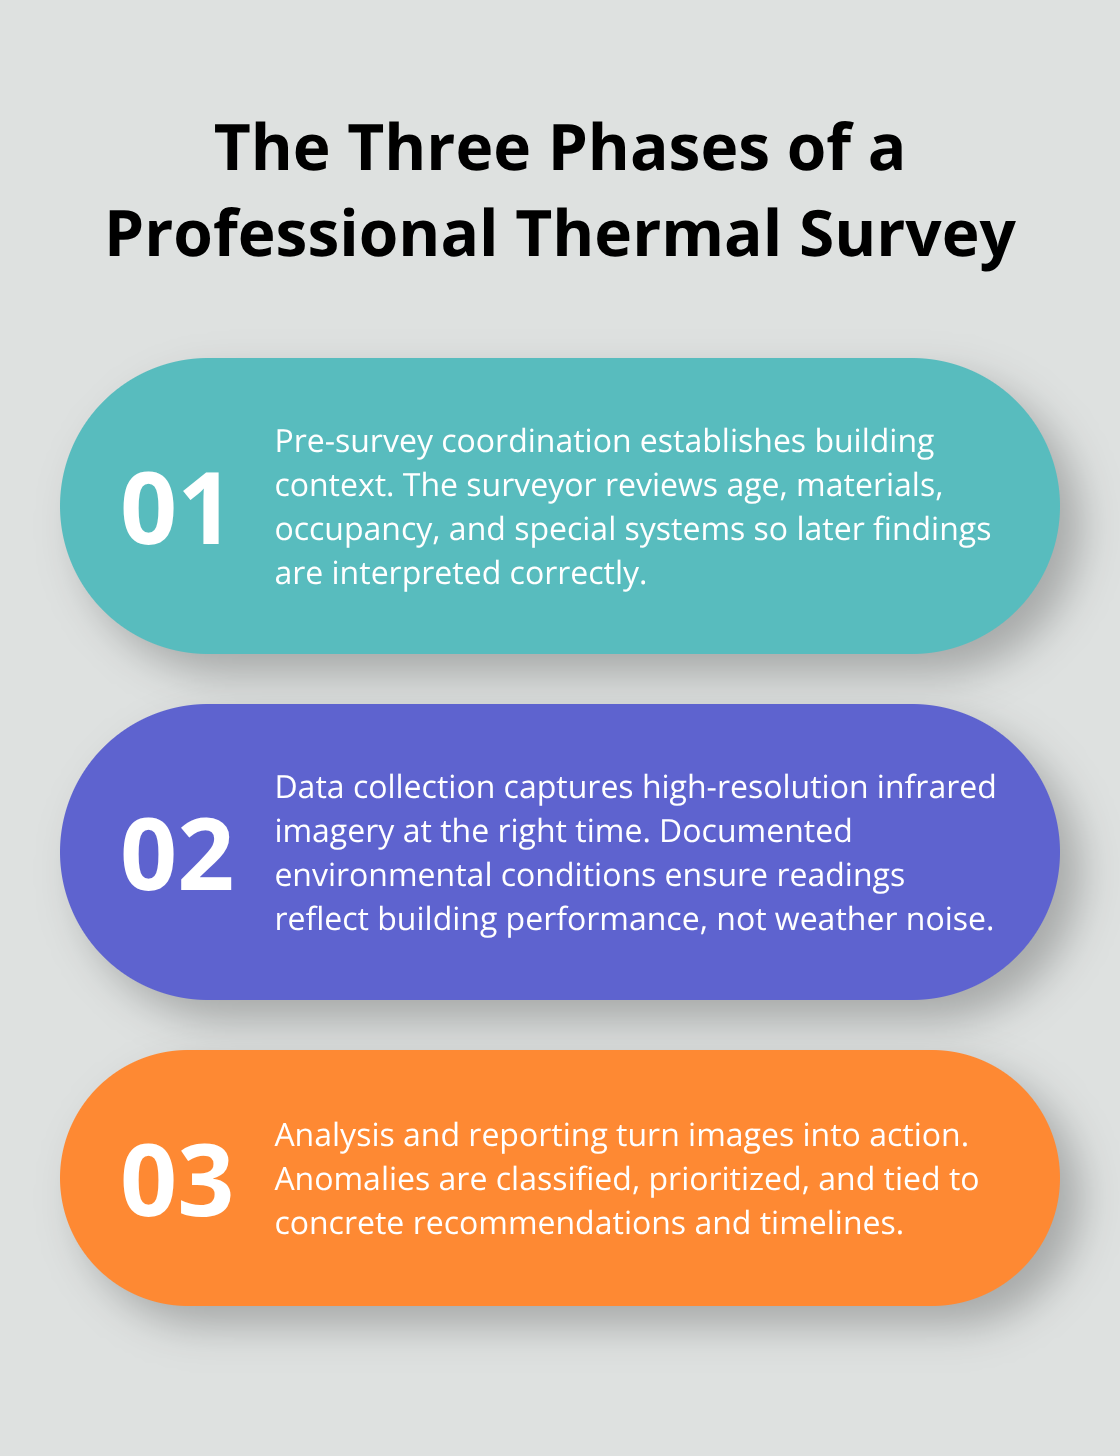
Professional thermal surveys follow a three-phase structure that separates reliable data from worthless readings. The first phase involves pre-survey coordination where the surveyor discusses your building’s age, construction materials, occupancy patterns, and specific concerns with you before any thermal camera appears on site. This conversation matters because a building with radiant floor heating, active ventilation systems, or recent solar installations will produce completely different thermal signatures than a standard structure, and the surveyor needs this context to interpret heat maps accurately.
Data Collection and Camera Positioning
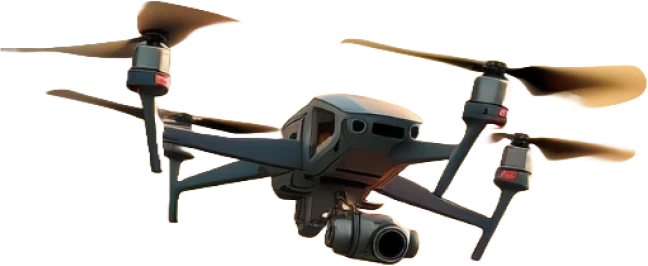
The second phase is data collection using high-resolution thermal cameras mounted on aircraft, which capture infrared imagery across your entire building exterior and roof systems at a specific moment in time. Timing of this capture is critical-surveys conducted at night or immediately after sunrise produce clearer results because reduced solar interference minimizes reflective distortion that can obscure actual insulation problems. Environmental conditions at the moment of capture get documented in your final report because wind, rain, and humidity all influence thermal readings.
Data collection altitude and camera positioning directly affect the detail visible in your final heat maps. High-resolution thermal imaging from aircraft captures infrared data across large areas, but this precision depends on maintaining consistent altitude and accounting for surface reflectance from different materials on your building exterior. Surveyors position cameras perpendicular to building surfaces rather than at angles because oblique angles introduce thermal distortion and make accurate temperature readings impossible.
Analysis and Report Generation
The third phase involves processing the raw infrared data into heat maps and analyzing those maps within the context of your building’s specific materials, design, and operational status. A surveyor trained in thermography principles recognizes that a red zone on a roof might indicate severe insulation failure, an active ventilation exhaust, or thermal bridging from structural elements, and the correct interpretation determines whether you invest in expensive retrofits or accept normal building conditions.
After data collection concludes, the analysis phase translates raw thermal imagery into actionable recommendations specific to your property. A professional report doesn’t just show you red and orange zones on a heat map-it explains what caused each thermal anomaly, whether it requires immediate repair or can be addressed during your next maintenance cycle, and which repairs deliver the highest return on investment. Professional thermal survey reports should include annotated heat maps linked to specific images that show exactly where problems exist, rough cost estimates for addressing identified issues, and a prioritized timeline for repairs based on severity and energy impact.
Transforming Data Into Action
This level of detail transforms thermal data from abstract temperature readings into a concrete roadmap for building improvements. Thermal surveys only have value when they produce actionable intelligence that property owners can implement immediately. Reports that go beyond imagery to deliver specific, prioritized recommendations tied directly to your building’s performance and your maintenance budget give you the information needed to make confident investment decisions about your property.
Conclusion
Thermographic building surveys deliver three concrete benefits that property owners can measure immediately: they identify exactly where energy waste occurs, they catch moisture damage before structural repairs become necessary, and they provide clear evidence for real estate negotiations. A building losing heat through failed insulation in specific roof sections can target retrofit spending on those exact areas rather than replacing entire systems. Moisture damage caught through thermal imaging costs thousands to remediate; the same damage left undetected costs tens of thousands once structural deterioration accelerates.
Standard building inspections require physical access to roofs, crawl spaces, and mechanical rooms, creating safety risks and scheduling delays. Thermal surveys capture your entire building’s thermal signature in a single data collection session, eliminating the need for multiple site visits and reducing disruption to your operations. The resulting heat maps provide visual documentation that eliminates ambiguity during property sales or lease negotiations-buyers and tenants see exactly what condition your building is in rather than relying on verbal descriptions or vague inspection notes.
We at IE Drone Services use high-resolution infrared cameras mounted on aircraft to capture precise thermal data across your entire property. Our team delivers annotated heat maps with specific, prioritized recommendations tied directly to your building’s performance and maintenance budget. Contact us today to schedule your thermographic building survey and transform abstract temperature readings into actionable intelligence for your property.