Solar panels that look fine on the surface often hide serious problems underneath. An infrared solar panel scan reveals heat patterns that indicate failing modules, electrical faults, and safety risks before they become expensive failures.
At IE Drone Services, we’ve seen firsthand how thermal imaging catches issues that standard visual inspections miss. Regular thermal monitoring protects your investment and keeps your system running at peak efficiency.
What Thermal Images Actually Show About Your Solar Panels
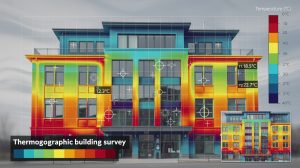
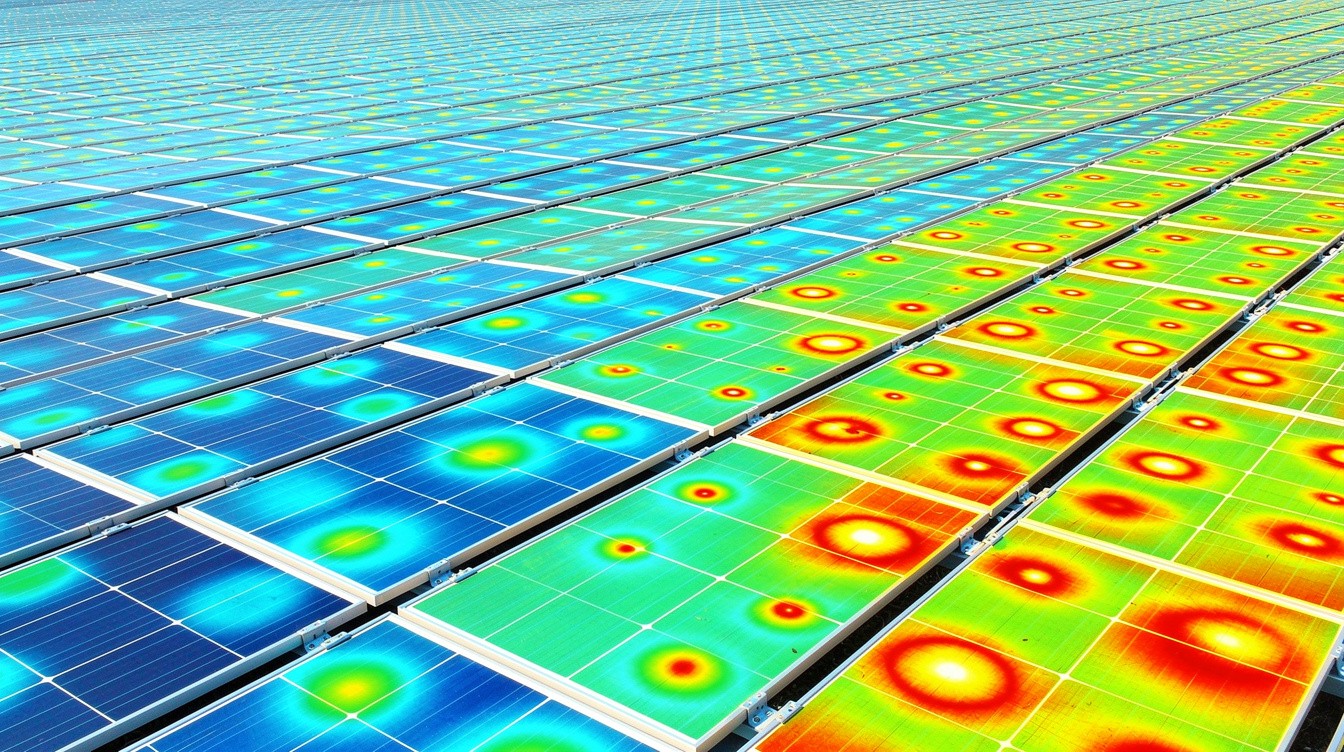
Thermal imaging works because defective solar cells generate heat instead of electricity. When a cell fails, develops a bypass diode malfunction, or suffers internal damage, it becomes negatively biased and converts electrical energy into thermal energy. An infrared camera captures this heat signature in real time, revealing problems that remain completely invisible during standard visual inspections. The temperature differences between healthy and damaged cells are often dramatic. Field-aged multicrystalline silicon modules showed average hotspot-to-cold-cell temperature differences of about 10 degrees Celsius, according to research published through the International Energy Agency PVPS Task 13 program. This 10-degree swing indicates significant localized heating from optical and electrical degradation. Over roughly 20 years, optically degraded modules in that same study declined at an average rate of 0.8 percent in efficiency per year, meaning a panel rated at 100 watts could drop to 82 to 84 watts by year 20.
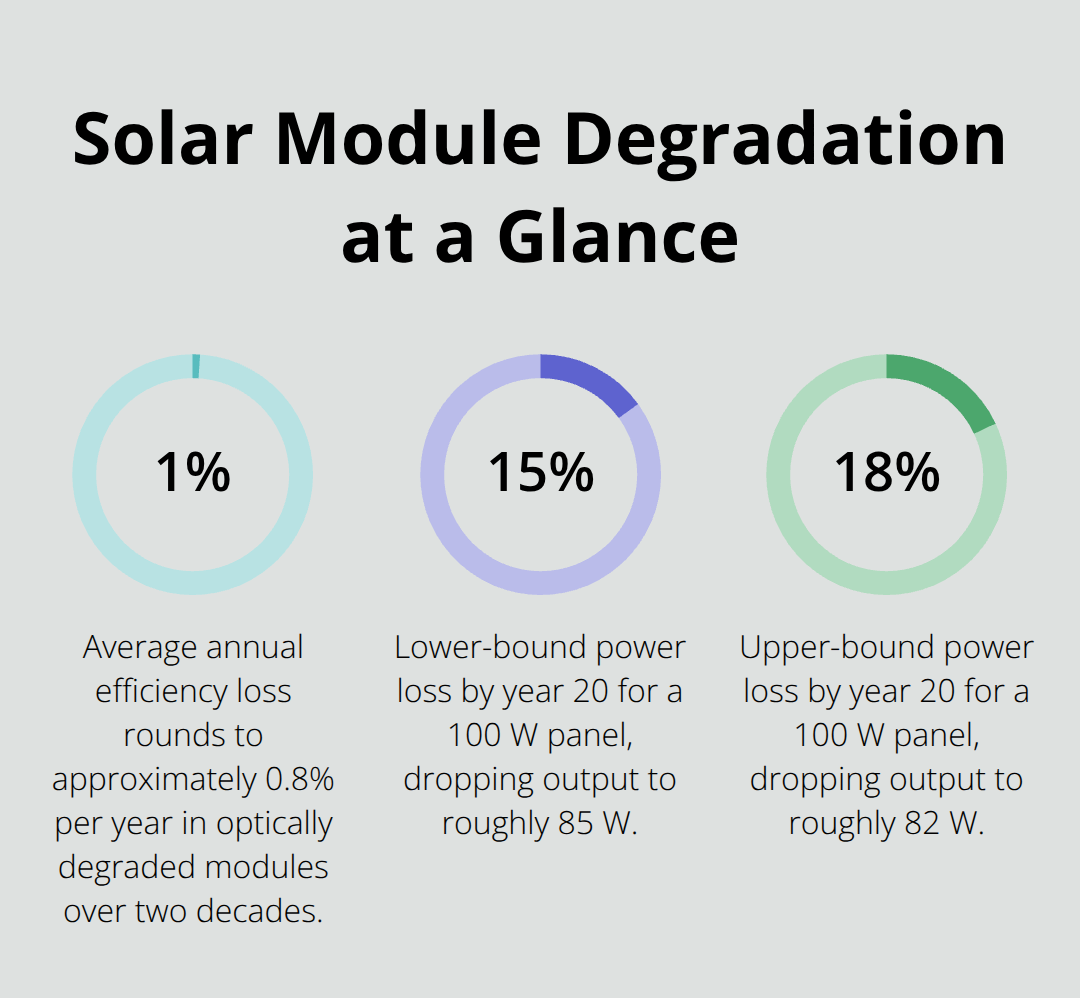
That represents a 15 to 18 percent power loss that thermal imaging could have caught and prevented if monitored regularly.
Hotspots reveal cell-level failures before they spread
Hotspots appear as bright spots on thermal images and indicate individual cells or groups of cells operating at significantly higher temperatures than surrounding cells. External damage, manufacturing defects, shading, torque issues during installation, and catastrophic panel failures all produce hotspots. The critical insight is that hotspots do not stay isolated. A single failing cell generates heat that degrades neighboring cells over time, creating a cascading failure pattern. Electroluminescence imaging studies show that hotspots visible in infrared align precisely with dark spots in EL images, confirming that thermal anomalies correspond to genuine electrical defects and resistance losses. This direct correlation means thermal scans provide exact fault locations. You must record the string number, panel serial number, and exact position of the hotspot to enable targeted repairs and warranty claims. Without this location data, you cannot efficiently replace the right panel or pursue supplier action.
Electrical faults hide in combiner boxes and inverters
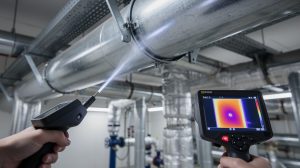
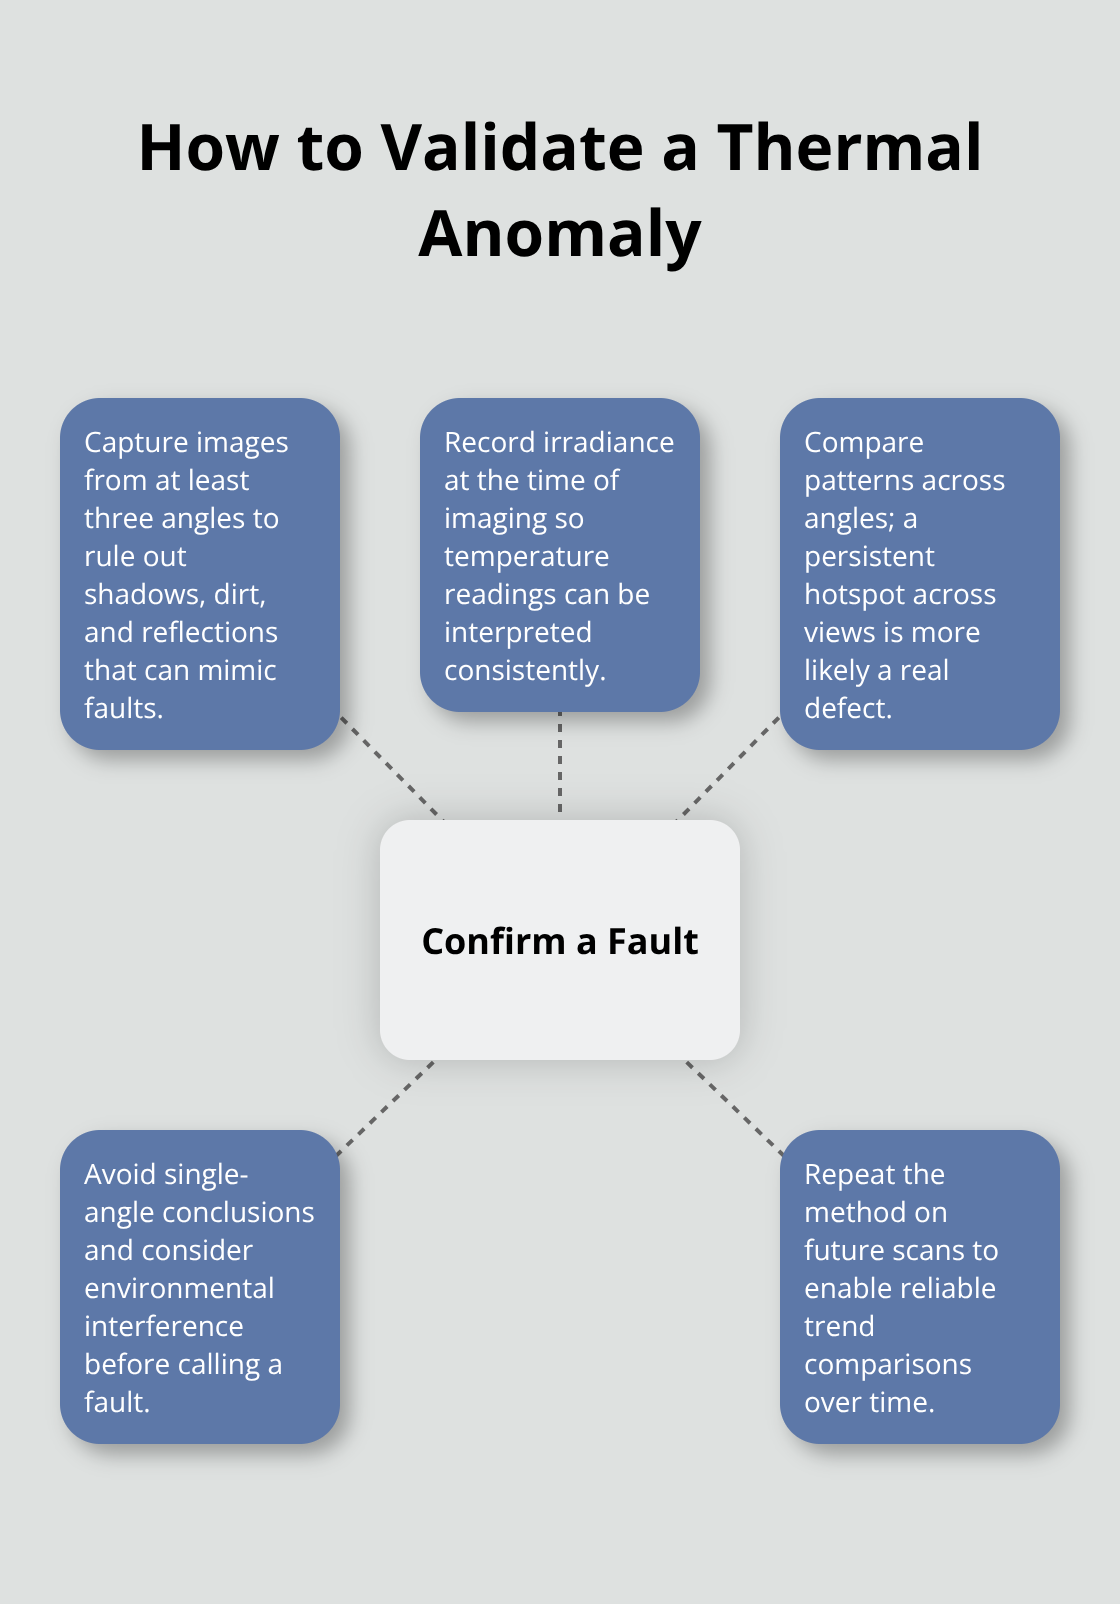
Module-level hotspots represent only part of the picture. Combiner boxes, service disconnects, and inverters also generate detectable heat signatures when electrical faults develop. Loose connections, poor ventilation, and failing components inside these boxes cause temperature rises that thermal images reveal. For combiner boxes and service disconnects, a temperature difference under 2 degrees Celsius indicates no real concern, but anything above 2 degrees warrants investigation. Inverters require evaluation through comparison with neighboring units to confirm cooling effectiveness and identify underperforming units. You must record irradiance at the time of imaging because temperature readings vary with solar intensity. Scans performed at irradiance levels below 600 watts per square meter produce unreliable results, though anomalies with high contrast can appear at irradiance as low as 100 watts per square meter. Comparing multiple angles and accounting for shadowing and dirt prevents false positives. A single thermal image from one angle can mislead you. Taking at least three images from different angles with recorded irradiance gives you the data needed to confirm whether a heat signature indicates a real fault or environmental interference.
What happens next with your thermal data
Once you capture thermal images with proper documentation, the next step involves analyzing what those patterns mean for your system’s health and safety. The data you collect-irradiance levels, temperature differentials, equipment serial numbers, and precise fault locations-forms the foundation for maintenance decisions and warranty actions.
Why Thermal Scanning Stops Energy Loss
Thermal scanning identifies energy losses that drain your ROI before they become catastrophic failures. When a module operates with a 10-degree Celsius hotspot, it does not simply generate excess heat-it stops producing electricity efficiently. Research from the International Energy Agency PVPS Task 13 program documented that optically degraded modules lost 0.8 percent in efficiency per year over two decades. Thermal imaging catches these degradation patterns early, when replacement or repair costs far less than accepting years of reduced output. Without regular scans, you operate blind to performance theft happening in real time.
Loose connections drain output silently
Combiner box temperature differentials above 2 degrees Celsius indicate loose connections that steal 3 to 5 percent of system output annually. Once identified and corrected, those systems recover full performance. The financial case is straightforward: a single thermal scan costs hundreds of dollars, while the energy losses it prevents save thousands over your system’s remaining lifespan. Thermal cameras reveal these electrical faults while your system remains operational, eliminating downtime during diagnosis.
Hotspots progress into cascading failures
Hotspots progress from localized heat to cascading cell failures if left unaddressed. A single defective cell generates heat that degrades neighboring cells, accelerating the failure chain. Electroluminescence studies confirm that hotspots visible in thermal images align with electrical defects and resistance losses in the exact same locations, meaning thermal data points directly to the problem. When you document the string number, panel serial number, and precise hotspot position during your scan, you enable targeted replacement rather than guesswork. External damage, manufacturing defects, shading, and installation torque issues all produce detectable hotspots that thermal imaging reveals before secondary damage spreads.
Fire risk demands immediate action
Unaddressed hotspots create fire risk. Modules that convert electrical energy into thermal energy at high temperatures can reach conditions that ignite surrounding materials under the right circumstances. Inverters and service disconnects also show degradation through temperature rises that thermal cameras capture while your system remains operational. Taking three thermal images from different angles at irradiance levels above 600 watts per square meter provides the reliable data needed to confirm whether a heat signature is real or environmental noise. Once confirmed, you act decisively-replacing the panel, initiating warranty claims, or addressing electrical faults in combiner boxes before they compromise safety or performance.
The data you collect during thermal scans (irradiance levels, temperature differentials, equipment serial numbers, and precise fault locations) forms the foundation for maintenance decisions and warranty actions. This information also reveals what happens next in your system’s health and safety profile.
How Thermal Cameras Capture Solar Panel Heat
Thermal cameras detect infrared radiation emitted by objects and convert it into visible temperature maps. Unlike standard cameras that show what you see with your eyes, infrared cameras measure heat signatures across your entire solar array simultaneously. The camera’s sensor reads wavelengths in the 7 to 14 micrometer range, which correspond to thermal energy radiating from your panels and electrical components. You must calibrate the camera for humidity, atmospheric temperature, distance, and emissivity before scanning to get reliable thermal data. Emissivity values typically run between 0.85 and 0.95 for solar panels, with 0.9 used as a standard baseline during image processing. The critical requirement is irradiance level at the time of imaging. Scans performed below 600 watts per square meter produce unreliable results because the temperature differentials between healthy and defective cells become too subtle to distinguish. Anomalies with high contrast can appear at irradiance as low as 100 watts per square meter, but consistent, actionable data requires stable conditions above 600 W/m². You must record the exact irradiance measurement during your scan using a pyranometer or the thermal camera’s built-in sensor. Without this number, you cannot compare results across multiple inspection dates or validate whether a heat signature represents a genuine fault or environmental noise.
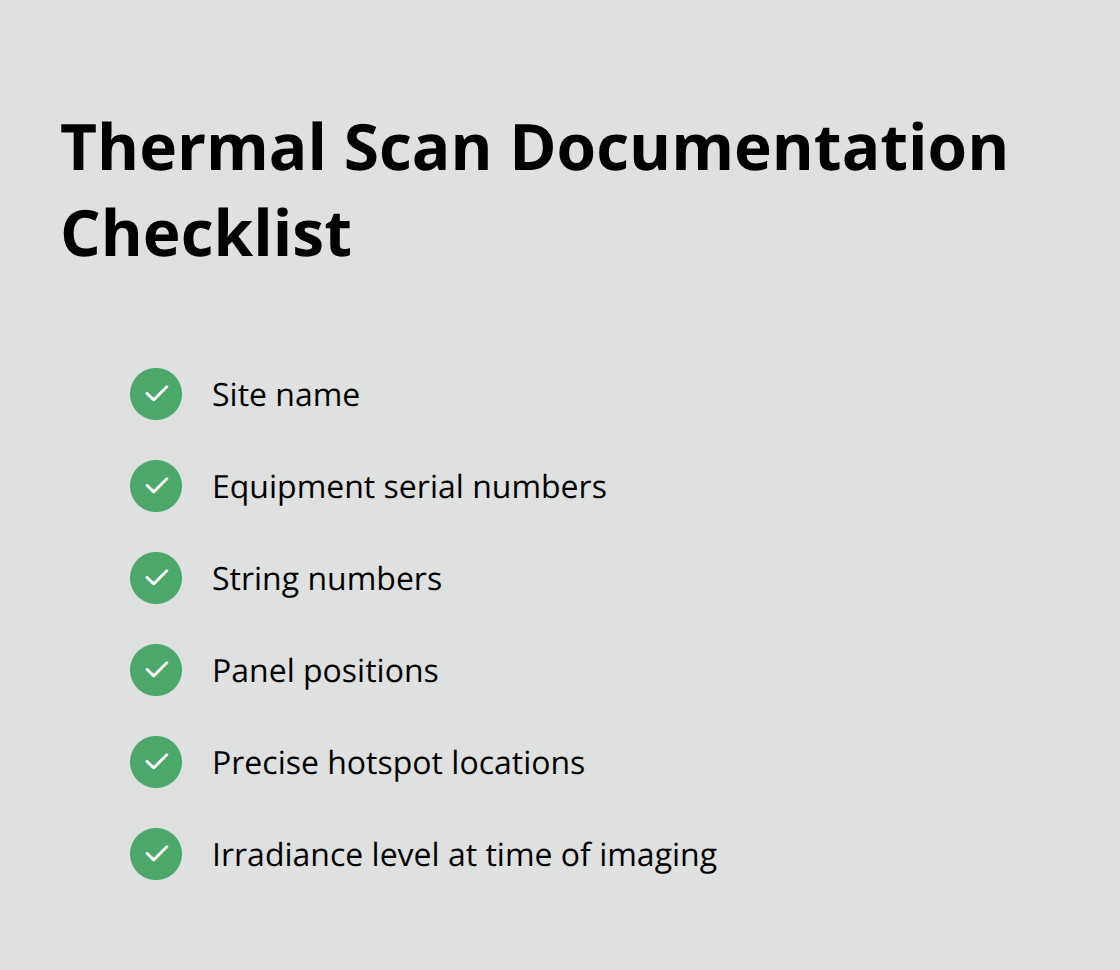
Three angles prevent misinterpretation
You should capture thermal images from three different angles to prevent misinterpretation caused by shadowing, dirt, or reflective surfaces. A single hotspot visible from one angle might disappear when viewed from another angle, indicating dirt or temporary shading rather than a defective cell. Comparing multiple angles and recording irradiance at the time of imaging gives you the confidence to act decisively on genuine faults. Documentation at this stage determines everything that follows. You need to record the site name, equipment serial numbers, string numbers, panel positions, and precise hotspot locations with irradiance levels. This information forms the foundation for warranty claims, targeted repairs, and long-term trend analysis. Without systematic documentation, you lose the ability to track whether a problem worsens over time or validate repairs after completion.
The data you collect during thermal scans directly enables maintenance decisions and warranty actions.
Delta T guidelines direct your maintenance response
Raw thermal images become useful only after analysis reveals what temperature differentials mean for your system’s health. Delta T guidelines provide the framework for interpretation. For individual solar panels, a temperature difference under 5 degrees Celsius between hotspots and cold cells typically does not require immediate action, though monitoring remains prudent. Temperature differences between 5 and 10 degrees Celsius warrant ongoing observation and documentation to track whether the problem progresses. Differences greater than 10 degrees Celsius indicate a potential problem requiring targeted intervention, whether that means panel replacement, warranty claims, or further electrical investigation. For combiner boxes and service disconnects, the threshold is much lower. Temperature differences under 2 degrees Celsius represent normal operation, but anything above 2 degrees demands investigation into loose connections or cooling failures. Inverters require comparison with neighboring units to confirm whether an elevated temperature indicates underperformance or simply higher ambient conditions around that specific location.
Electrical data confirms thermal findings
Analysis must cross-reference thermal findings with electrical performance data. Voltage and current measurements taken at the recorded irradiance level help confirm whether a thermal anomaly corresponds to genuine electrical degradation or measurement error. This correlation between thermal and electrical data eliminates guesswork and directs maintenance resources toward confirmed problems rather than false alarms. You gain confidence in your maintenance decisions when thermal and electrical evidence align, reducing the risk of unnecessary replacements or missed repairs that could compromise safety and performance.
Final Thoughts
Infrared solar panel scans reveal problems that remain invisible during standard visual inspections, protecting both your system’s performance and your safety. Field research shows that optically degraded modules lose 0.8 percent in efficiency per year, meaning regular thermal monitoring catches performance theft happening in real time and enables targeted repairs that recover lost output. The data you collect through thermal imaging-temperature differentials, equipment locations, irradiance levels, and precise fault positions-forms the foundation for maintenance decisions that prevent cascading failures and energy losses.
Loose connections in combiner boxes drain 3 to 5 percent of system output annually, yet thermal imaging identifies these faults while your system remains operational and eliminates downtime during diagnosis. Hotspots that progress into cascading failures create fire risk, but documented thermal data enables decisive action-panel replacement, warranty claims, or electrical repairs-before safety hazards develop. The cost of an infrared solar panel scan recovers many times over through the energy losses it prevents and the equipment lifespan it extends.
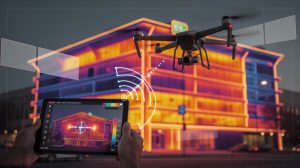
We at IE Drone Services use FAA-certified drone platforms equipped with high-resolution infrared cameras to deliver precise, actionable thermal inspections that guide your maintenance decisions. Our thermal inspections provide the systematic documentation you need to track system health over time and validate repairs after completion. Contact IE Drone Services to schedule your infrared solar panel scan and gain clear visibility into your system’s actual performance and safety profile.