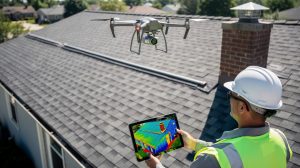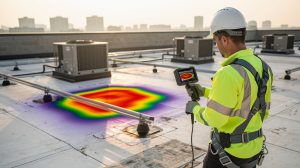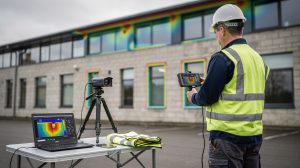
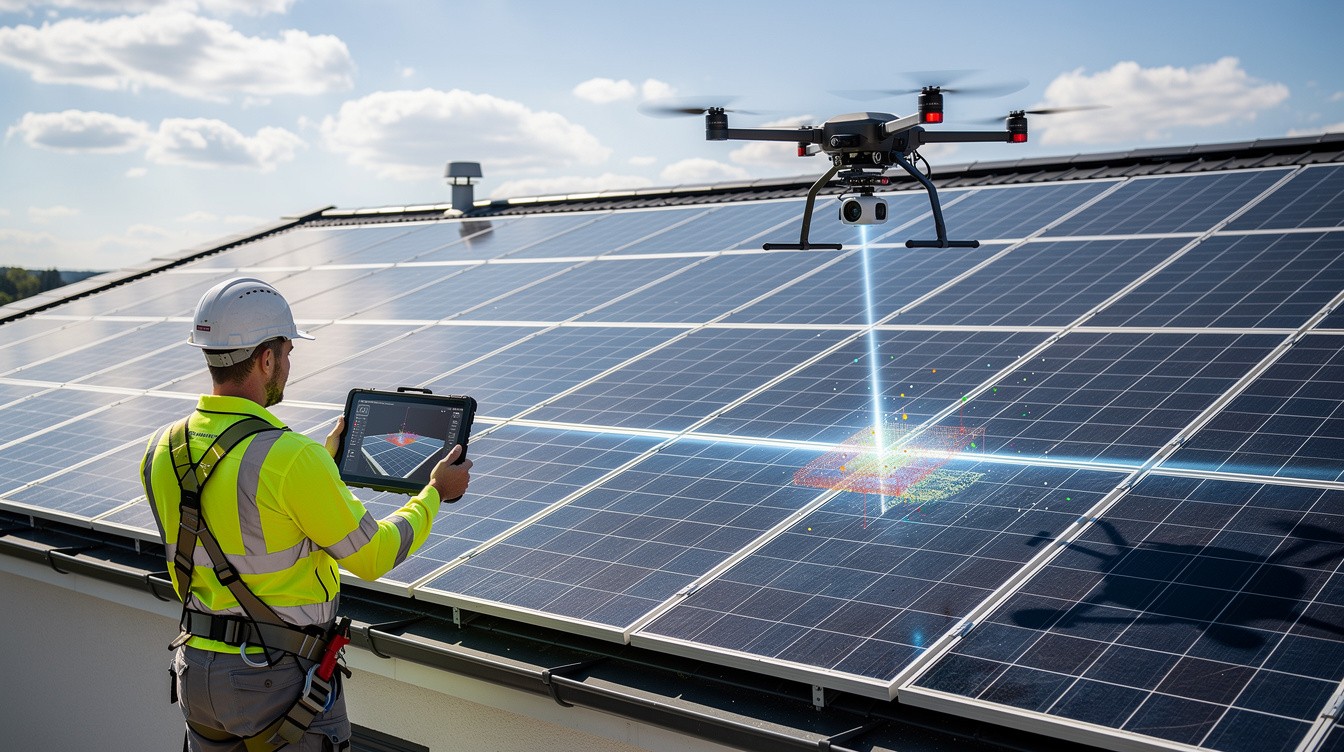
Solar installations need fast, accurate inspections to stay on schedule and perform at their best. At IE Drone Services, we use thermal imaging to scan your roof quickly and identify issues that slow down projects.
Speed matters when you’re managing timelines and budgets. Our fast solar panel scans deliver the data you need to make decisions fast, without the delays that come with traditional inspections.
Why Speed Matters for Solar Projects
Thermal imaging drones complete solar inspections in days instead of weeks, and that speed directly impacts your bottom line. Traditional roof evaluations require manual climbing, safety equipment, and multiple technicians working across the site for extended periods. Drone-based thermal scans capture the same data in a fraction of the time, with zero personnel on the roof. For a 75 MW solar farm spanning 500 acres, infrared drone data collection finishes in about a week compared to traditional methods. That compressed timeline moves your project forward faster, keeps your team on schedule, and eliminates the cost overruns that inspection delays create.
Labor Costs Drop Significantly
Labor represents the largest expense in manual solar inspections. A 5 MW farm inspected with a 20 percent module sample manually costs approximately $4,375 and roughly 125 technician-hours at $35 per hour, according to sUAS News. Drone inspections eliminate most of that labor burden. Industry data shows savings exceeding $1,915 per MW after switching to drone-based surveys. For a 100 MW field conducting bi-annual inspections over five years, the labor savings alone exceed $19,000. Thermal imaging drones also reduce the need for ground control points through Post-Processed Kinematics technology, which accelerates data processing and cuts operational costs further.
Hotspots and Faults Reveal Themselves Quickly
Solar installations lose money the moment a panel underperforms. Annual revenue losses across analyzed assets averaged about $82 million in 2022, or roughly $3,350 per MW according to Raptor Maps. Quick thermal scans identify hotspots, bypass diode failures, and electrical faults before they cascade into widespread performance degradation. Hotspots alone contribute 0.5 to 3 percent of total generation loss. Early detection through rapid inspection cycles prevents these losses from compounding over months. Drone surveys typically cost $150 to $500 per MW, making the inspection investment recover itself through improved performance detection and targeted maintenance planning.
Thermal Data Guides Your Next Steps
Thermal imaging reveals issues invisible to the naked eye-micro-cracks, delamination, and electrical anomalies that affect output. The inspection workflow identifies these problems early, enabling maintenance teams to prioritize repairs based on actual performance impact rather than guesswork. High-resolution thermal data (combined with RGB imagery) creates a comprehensive health profile for each solar array. This actionable intelligence transforms raw inspection data into specific repair recommendations, allowing you to allocate maintenance budgets where they matter most. When you’re ready to move forward with thermal solar inspections, understanding the complete scanning process helps you prepare your site and maximize the value of the data you receive.
What Thermal Imaging Reveals About Your Solar Panels
Thermal imaging works because every solar panel generates heat when electricity flows through it. A healthy panel operates at a consistent temperature across its surface. The moment a defect develops-a cracked cell, a failed bypass diode, a loose connection-that spot heats up differently than the surrounding area. Infrared cameras reveal heat patterns across solar panels that visual inspection misses entirely, showing you exactly where problems exist before they tank your energy output. According to the IEC TS 62446-3 standard, a valid thermal inspection requires irradiance of at least 600 W/m² and wind speeds below 28 km/h. The key metric is the temperature difference, or ΔT: a panel section that runs more than 10°C hotter than adjacent cells signals an immediate fault requiring action, while 5 to 10°C warrants investigation. Below 5°C, monitoring at your next inspection cycle makes sense. This standardized approach means your thermal data stays comparable across multiple inspections, letting you track degradation over time and spot problems before they worsen.
Temperature Patterns Expose Specific Defects
Different defects create distinctive thermal signatures that tell you what went wrong. A single cell running hot points to a crack in the silicon wafer.
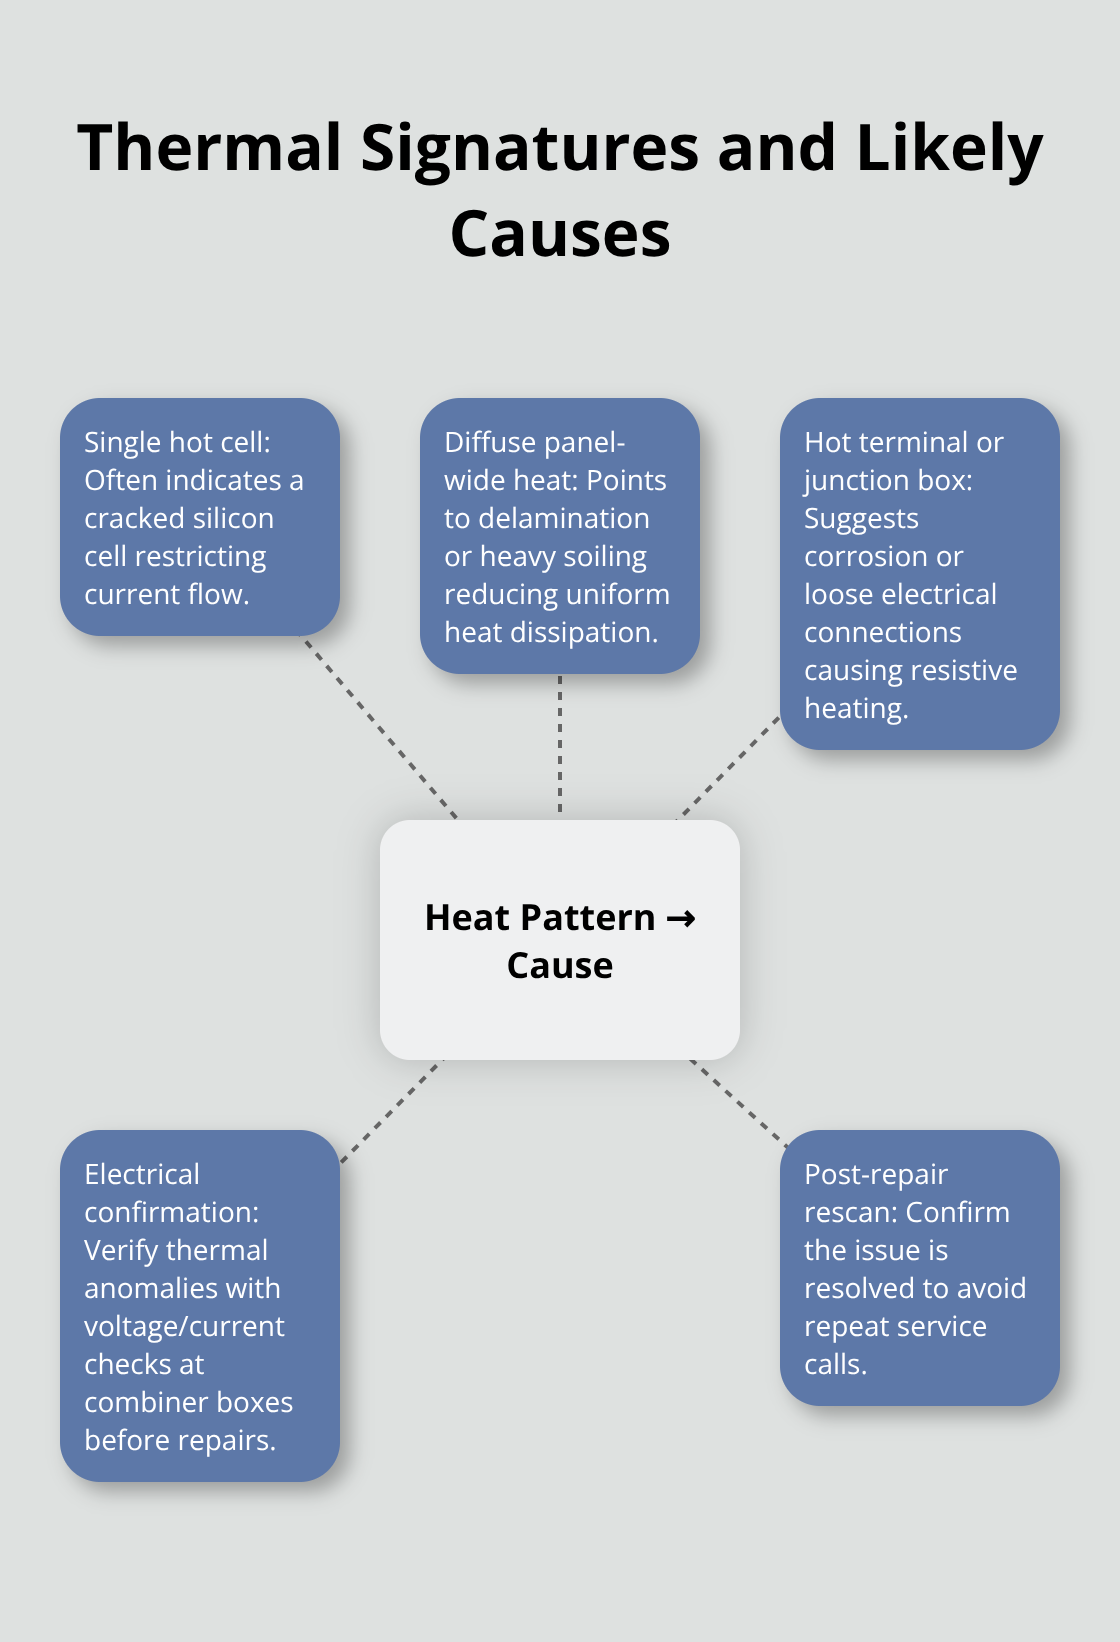
Stripe patterns across multiple cells indicate bypass diode failure, which can reduce string voltage and cause localized heating that potentially damages the cells. Diffuse heat spreading across an entire panel suggests delamination or heavy soiling, while heat concentrated at a terminal or junction box reveals corrosion or loose electrical connections. The IEA PVPS research shows that crystalline silicon modules degrade at a median rate of 0.5 percent per year under normal conditions, but defective modules degrade far faster, making early thermal detection genuinely valuable. Once you identify a thermal anomaly, electrical confirmation is essential-your maintenance team should perform voltage and current checks at the combiner box to confirm the fault before authorizing repairs. Rescanning after repairs verifies the problem is actually resolved, preventing wasted service calls. This diagnostic precision means maintenance budgets go directly to fixing real problems, not chasing false positives from bird droppings or temporary shadows.
Baseline Thermograms Build Your Long-Term Strategy
The most powerful tool in thermal solar inspection is a commissioning baseline-a complete thermal scan performed when the system is brand new. Every future inspection compares directly against this baseline, making it possible to catch gradual degradation that would otherwise slip past annual reviews. A new installation should receive its first thermal scan within six months of commissioning, then annually for commercial and utility-scale projects. Coastal, desert, and high-temperature environments justify more frequent cycles because environmental stress accelerates failures. DC connectors and combiner boxes contribute to roughly 42 percent of all PV system fires, underscoring why regular thermal inspection matters for safety and liability. Precise documentation-mapping each anomaly to its string number, panel position, component type, ΔT reading, and irradiance level-supports warranty claims and insurance documentation if equipment failure occurs.
Documentation Protects Your Investment
Thorough records transform thermal imaging from a one-time check into a core asset management practice. Each scan creates a data trail that shows how your system ages, which components fail first, and where maintenance dollars produce the highest returns. This information-rich approach protects your investment and maximizes system longevity while giving you the evidence you need if disputes arise with equipment manufacturers or insurers. When you’re ready to capture this thermal data for your solar installation, understanding how to prepare your site and coordinate the inspection logistics ensures the scanning team collects complete, actionable information on the first visit.
How to Prepare Your Solar Site for Fast Thermal Scanning
Schedule Your Inspection for Optimal Conditions
Thermal imaging works best when irradiance reaches at least 600 W/m² and wind speeds stay below 28 km/h, according to IEC TS 62446-3 standards. Schedule your inspection on a clear day with minimal cloud cover, ideally mid-morning through early afternoon when solar irradiance peaks. Contact your system operator in advance to confirm grid conditions and any operational restrictions that might affect the scanning timeline. If your installation spans multiple buildings or arrays, identify access points for the drone team and confirm parking and safety zones before the crew arrives.
Prepare Site Documentation and Logistics
Provide the scanning team with a site map showing combiner boxes, disconnects, inverters, and any balance-of-system components that require inspection. These electrical components cause roughly 42 percent of PV system fires, so thermal data from junction boxes and connectors matters as much as panel surface temperatures. Inform the team about any recent weather events, soiling, bird activity, or maintenance work that might affect thermal readings. This context helps the scanning team distinguish real faults from temporary false positives caused by shadows, bird droppings, or dust. For rooftop installations, confirm that the drone can safely operate from your roof or from adjacent areas without interfering with ongoing operations. Most thermal scans complete in a single visit, so clear logistics upfront eliminates rescheduling delays.
Transform Raw Data Into Actionable Reports
Once the drone captures thermal imagery, data processing transforms raw images into actionable intelligence. The scanning team processes thousands of individual measurements with pixel-precise geo-coordinates, then overlays thermal data onto high-resolution RGB imagery to pinpoint exact defect locations. This multi-sensor fusion creates a detailed health profile showing temperature differentials across every panel and component. Your final report maps each thermal anomaly to its specific string number, panel position, and ΔT reading, along with irradiance levels recorded during the scan. This documentation supports warranty claims and insurance disputes if equipment failure occurs.
Prioritize Repairs Based on Thermal Findings
The report identifies immediate faults requiring urgent repair, areas warranting investigation, and zones suitable for continued monitoring. Comprehensive findings translate thermal data into specific maintenance priorities, helping you allocate repair budgets where they produce the highest performance returns. Your maintenance team then performs electrical confirmation at combiner boxes to verify each thermal anomaly before authorizing repairs, preventing wasted service calls on false positives. Rescanning after repairs confirms the problem is actually resolved, ensuring your system operates at peak efficiency.
Final Thoughts
Fast solar panel scans transform how you manage your installation’s health and performance. Thermal imaging drones deliver the speed and accuracy that traditional inspections cannot match, completing comprehensive evaluations in days instead of weeks while identifying faults that cost you money every day they remain undetected. The data you receive maps specific defects to exact panel locations, reveals temperature differentials that signal immediate problems, and provides the documentation you need for warranty claims and maintenance planning.
A 100 MW solar field saves over $19,000 in labor costs alone through bi-annual drone inspections over five years. Early detection of hotspots, bypass diode failures, and electrical anomalies prevents the $3,350 per MW in annual revenue losses that underperforming systems generate. Speed combined with accuracy eliminates guesswork from your maintenance decisions and directs repair budgets where they produce measurable returns.
We at IE Drone Services understand that your solar installation represents a significant investment. Our FAA-certified team uses high-resolution and infrared cameras to deliver precise thermal data that guides your maintenance decisions, and we transform raw thermal data into actionable reports your team can act on immediately. Contact IE Drone Services today to schedule your fast solar panel scan and start capturing the performance data that keeps your system running at peak efficiency.