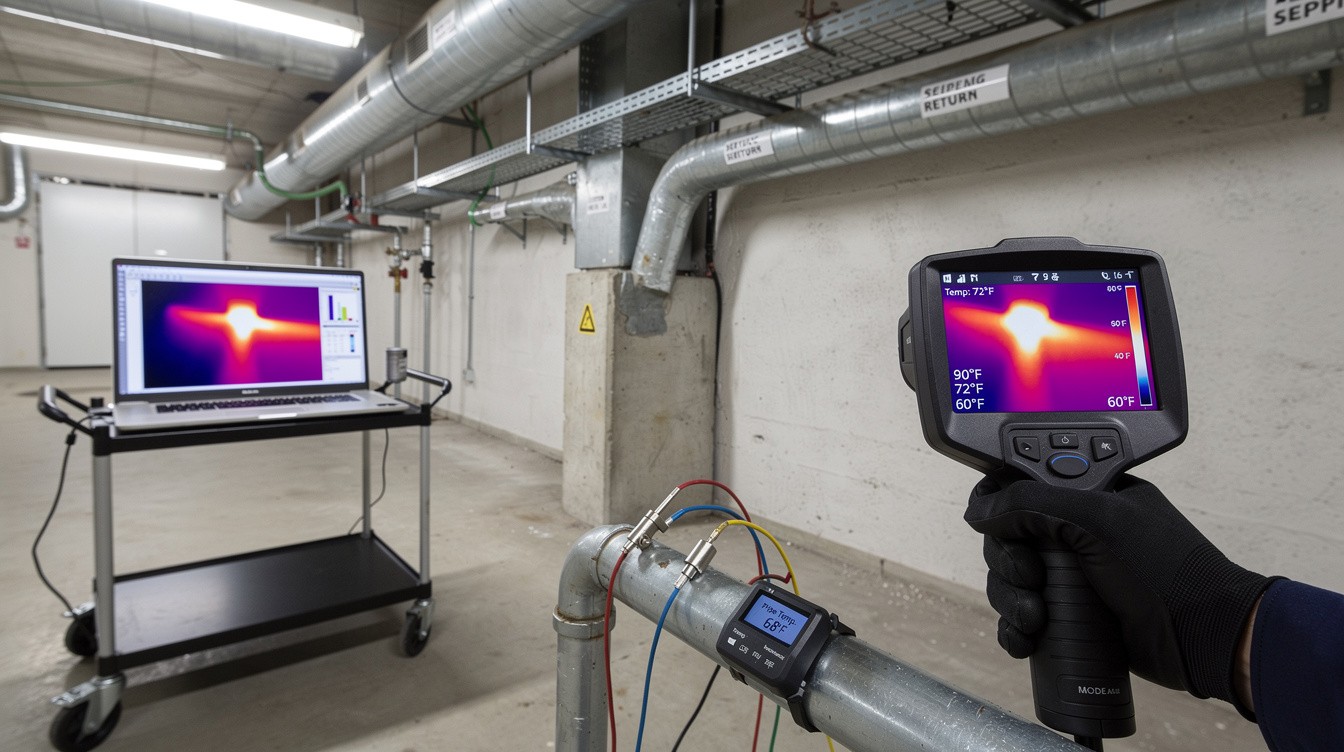
Most building owners don’t realize how much energy escapes through walls, roofs, and poorly sealed gaps. Building heat mapping reveals exactly where your property is losing money, turning invisible heat loss into visible data you can act on.
At IE Drone Services, we use thermal imaging to identify inefficiencies that standard inspections miss. The result is concrete savings and a more comfortable building for everyone inside.
How Thermal Imaging Reveals Hidden Heat Loss
Understanding Infrared Technology
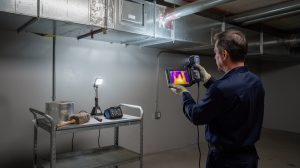
Thermal imaging cameras detect infrared radiation that objects emit, showing temperature differences across building surfaces with precision that the human eye cannot match. These cameras measure heat signatures rather than visible light, which means they function equally well during day or night. The technology translates temperature variations into color-coded images where warm areas appear red or yellow and cool areas show blue or purple. This visual representation immediately shows where heat escapes, whether through poor insulation, air leaks, or equipment failures.
The Scale of Energy Loss
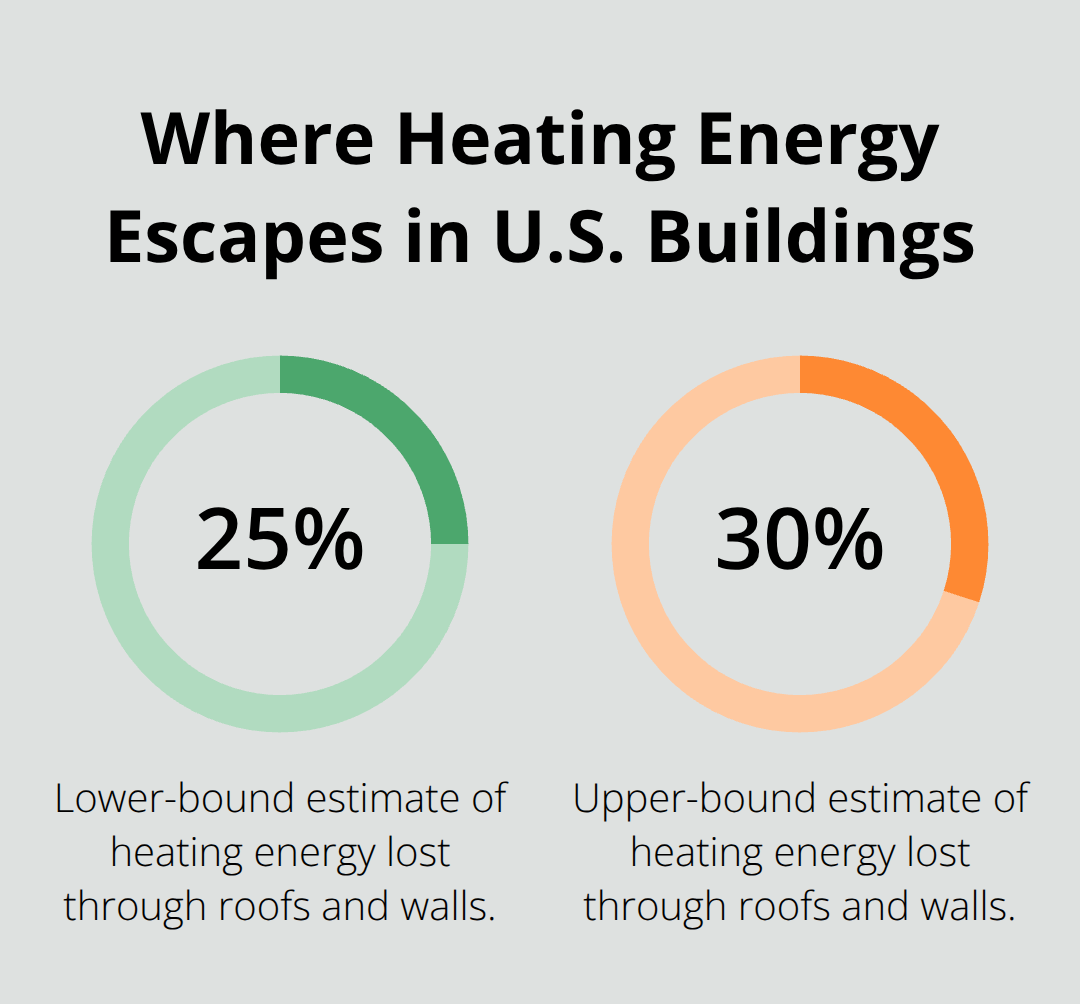
Buildings lose approximately 25 to 30 percent of their heating energy through the roof and walls according to the U.S. Department of Energy, making thermal imaging an effective tool for identifying these specific loss points. Standard visual inspections miss these inefficiencies entirely because heat loss leaves no visible marks. A small gap in insulation or a single malfunctioning HVAC damper can cost property owners hundreds of dollars annually in wasted energy. This hidden waste compounds year after year, turning minor inefficiencies into significant financial drains.
Drone-Based Thermal Inspection Advantages
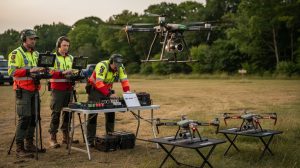
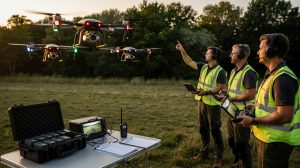
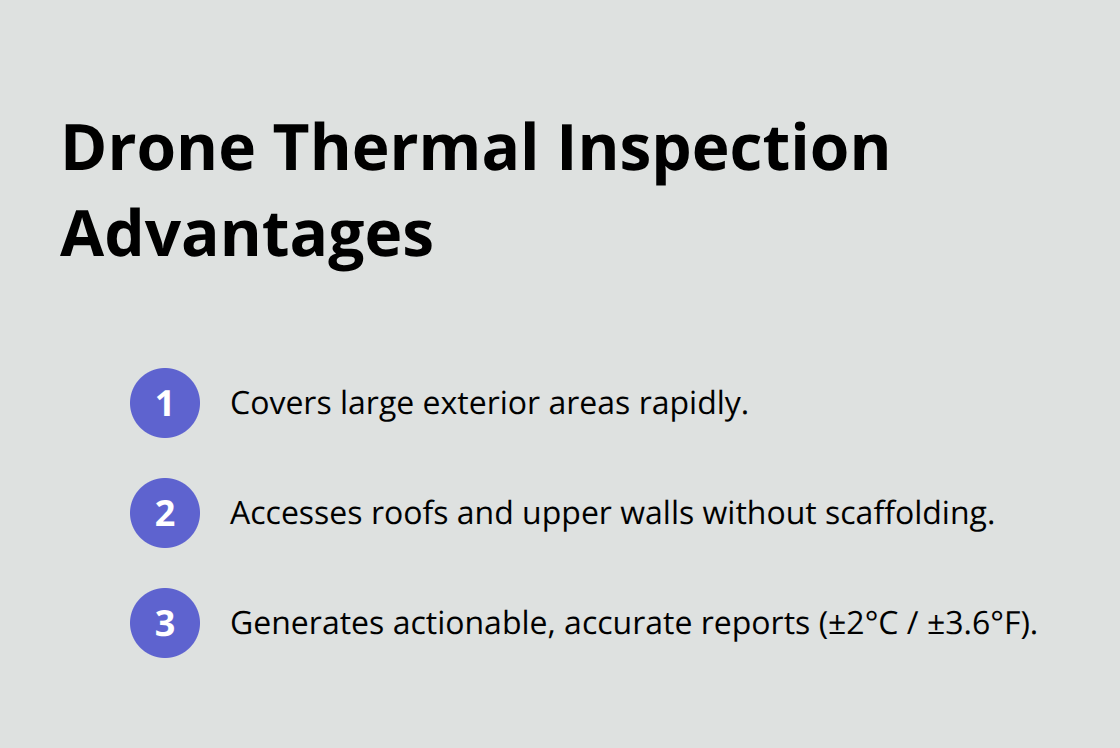
We at IE Drone Services deploy high-resolution infrared cameras mounted on FAA-certified drone platforms to capture thermal data across entire building exteriors without requiring scaffolding or roof access. Drone-based thermal imaging covers large areas faster than ground-level inspections and reaches sections of roofs and upper walls that inspectors cannot safely access. Real-time processing transforms raw thermal data into actionable reports that pinpoint exact locations of energy waste, with temperature readings accurate to within 2 degrees Celsius (approximately 3.6 degrees Fahrenheit).
Converting Data Into Actionable Insights
The visualization process creates thermal maps that overlay on building imagery, allowing you to see problem areas in context rather than abstract data. This combination of speed, safety, and accuracy makes thermal imaging the most efficient method for identifying where your building loses money. Once you understand exactly where heat escapes, you can prioritize repairs and investments that deliver the highest return. The next step involves examining what these thermal maps actually reveal about common building vulnerabilities.
What Heat Mapping Reveals About Your Building
Air Leaks: The Silent Energy Drain
Thermal imaging exposes air leaks as the primary culprit behind building energy waste, accounting for roughly 25 to 30 percent of heating loss. Most building owners never identify where these leaks occur without thermal data. Unsealed window frames, gaps around electrical outlets, and improper weatherstripping around doors create pathways for conditioned air to escape. Thermal maps show these breaches as distinct cold spots during heating season, allowing you to prioritize repairs by severity. Foundation and basement walls often leak heat at corners and where concrete meets the structure, while roof penetrations around vents and chimneys frequently display temperature anomalies that indicate insulation failure or moisture intrusion.
HVAC System Failures That Thermal Imaging Catches
HVAC failures represent the second-largest source of building energy waste after envelope leaks, yet thermal imaging identifies these problems in hours rather than days or weeks. A malfunctioning damper in one zone shows as inconsistent temperature distribution across that area, while ductwork separation or poor connections reveal themselves as thermal discontinuities that visual inspection would miss entirely. A typical home loses 20-30% of conditioned air due to holes, leaks, disconnected air ducts, and poorly installed connections. Thermal imaging captures these failures immediately, transforming what would require manual ductwork inspection into actionable data you can act on.
Roof and Structural Heat Loss Patterns
Roof heat loss occurs predictably at structural penetrations, along edges where insulation compresses, and in areas where previous repairs created thermal bridges. Thermal imaging captures these patterns across entire roof surfaces, generating precise temperature data that shows exactly where insulation has settled, where moisture has compromised R-values, or where installation errors created cold spots (all problems that remain invisible to standard inspections). This data becomes your repair roadmap, allowing you to invest capital where it delivers measurable returns rather than guessing which problems matter most. Understanding these specific failure points prepares you to take action, which means examining the financial impact and practical next steps for your property.
What Heat Mapping Returns to Your Bottom Line
Financial Recovery Through Targeted Repairs
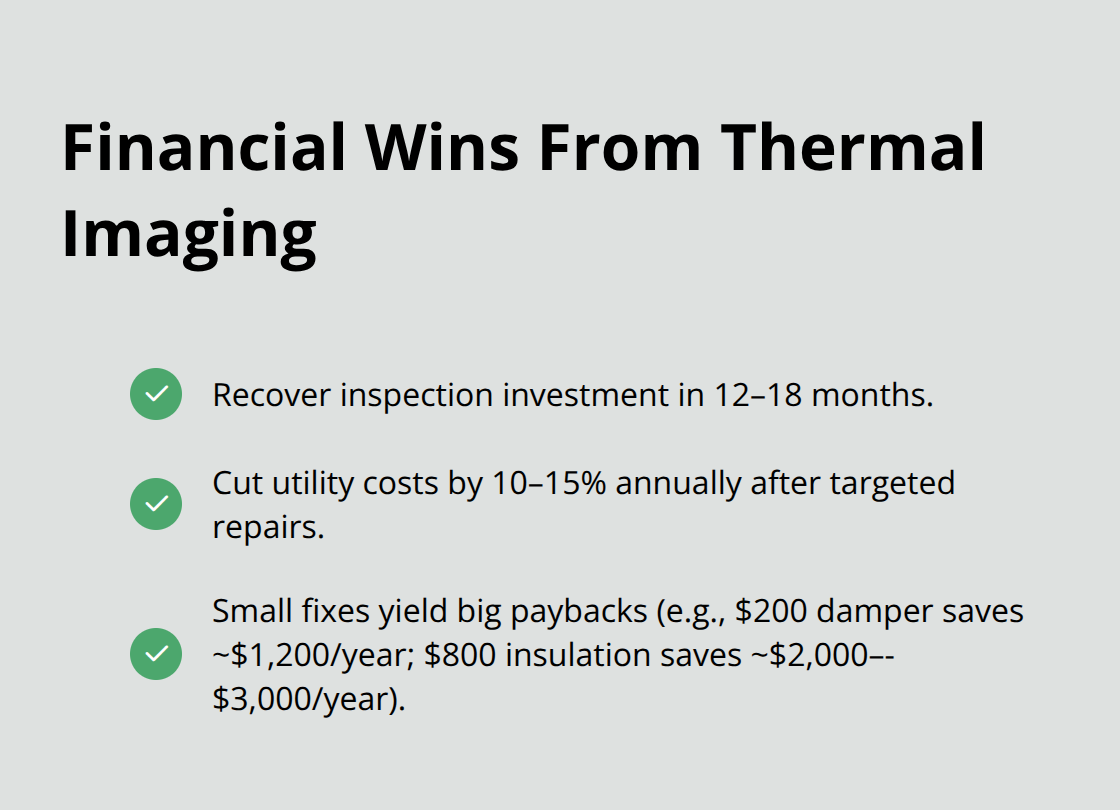
Thermal imaging transforms from a diagnostic tool into a financial asset the moment you act on its findings. Property owners who implement repairs identified through heat mapping typically recover their inspection investment within 12 to 18 months through reduced energy consumption alone, according to data from the Building Performance Institute. A commercial building losing 25 to 30 percent of heating energy through the envelope can reduce utility costs by 10 to 15 percent annually after addressing the specific inefficiencies thermal imaging reveals.
The precision matters here: you’re not guessing which problems cost you money or prioritizing repairs based on age and assumption. Thermal data shows exact locations of heat loss, allowing you to allocate capital where it delivers measurable returns. A single HVAC damper failure caught through thermal imaging might cost $200 to repair but prevents $1,200 in annual energy waste. Roof insulation gaps that thermal imaging identifies for $800 in repairs can save $2,000 to $3,000 annually depending on climate and building size.
Quantifying Savings With Precision Data
Thermal reports quantify these savings in specific dollar amounts, not estimates. This specificity means building owners can justify investments to boards and stakeholders with concrete data rather than industry averages. You stop making decisions based on assumptions and start making them based on what your building actually shows.
Tenant Comfort and Retention Benefits
Energy efficiency directly impacts tenant satisfaction and retention, particularly in competitive rental markets where operational costs influence lease terms. Tenants notice inconsistent temperatures, drafty areas, and climate control that fails to maintain comfort, and these problems drive vacancy rates higher than most property managers realize.
Studies from the American Council for an Energy-Efficient Economy show that occupants in thermally comfortable buildings report higher satisfaction and remain longer, reducing costly turnover and showing leasing periods that average 8 to 12 percent shorter. Addressing the specific comfort issues thermal mapping identifies means you solve real problems tenants experience rather than making generic HVAC improvements.
Preventing Expensive Structural Failures
Thermal imaging identifies structural and mechanical problems before they escalate into expensive failures. A roof leak prevention through thermal imaging can save significant repair costs if detected early, as undetected leaks accumulate expenses in repairs, downtime, and related damage. Ductwork separation visible in thermal data costs $800 to $2,000 to reconnect but prevents the mold growth and air quality degradation that creates tenant complaints and potential liability.
These preventive insights position property owners to control maintenance spending rather than react to emergencies that disrupt operations and tenant relationships. The data you obtain transforms maintenance from reactive crisis management into strategic planning.
Final Thoughts
Building heat mapping delivers three concrete outcomes that matter to property owners: lower energy bills, better tenant satisfaction, and fewer expensive surprises. The thermal data reveals exactly where your building loses money, transforms that invisible waste into visible problems you can fix, and quantifies the financial return from each repair. You stop guessing about energy efficiency and start making decisions based on what your building actually shows.
The path forward starts with a thermal inspection that captures your building’s complete heat loss profile. This assessment takes hours, not weeks, and produces a detailed report showing every inefficiency ranked by financial impact. Most property owners recover their inspection cost within 12 to 18 months through reduced utility consumption alone, with larger commercial buildings seeing 10 to 15 percent annual savings after addressing the specific problems building heat mapping identifies.
We at IE Drone Services use FAA-certified drone platforms equipped with high-resolution infrared cameras to deliver thermal building inspections that cover entire exteriors safely and quickly. Our drone-based approach reaches roof sections and upper walls that ground inspections cannot access and captures temperature data accurate to within 2 degrees Celsius. Contact us at iedroneservices.com to schedule your building heat mapping assessment and start converting energy waste into measurable savings.